Queries and Summaries
Queries
The TDataSelect class creates new TDataItem objects from other data and expressions, in a similar way to the SQL query language.
Note: TDataSelect implements the SQL language subset that does not involve aggregations (sum, count, min, max, average) or "group by" consolidations.
Aggregations are done using the TSummary class (see below).
Simple query examples
uses BI.DataSource;
var Query1 : TDataSelect;
Query1 := TDataSelect.Create;

// "select * from Customers"
Query1.Add(Customers);

// "select CompanyName, City from Customers order by City"
Query1.Add(Customers['CompanyName']);
Query1.Add(Customers['City']);
Query1.SortBy.Add(Customers['City']);

// "select distinct Country from Customers"
Query1.Add(Customers['Country']);
Query1.Distinct := True;

// "select top 5 UnitPrice from Products order by UnitPrice desc"
Query1.Add(Products['UnitPrice']);
Query1.SortBy.Add(Products['UnitPrice'], False);
Query1.Max:=5;
Selecting data from different tables does not require specifying the "from" and "where" SQL clauses as TeeBI knows the relationships between them:
"select Customers.CompanyName, ShipVia, Shippers.CompanyName from Orders, Customers, Shippers where Customers.CustomerID=Orders.CustomerID and Shippers.ShipperID=Orders.ShipVia"
Query1.Add(Customers['CompanyName']);
Query1.Add(Orders['ShipVia']);
Query1.Add(Shippers['CompanyName']);
TDataSelect includes also a Filter expression property (equivalent to SQL "where"):
"select distinct Country from Customers where Country <> "Mexico" order by Country"
Query1.Add(Customers['Country']);
Query1.SortBy.Add(Query1.Items[0]);
Query1.Distinct:=True;
Query1.Filter:=TDataFilter.FromString(Customers,'Country<>"Mexico"');
Expressions
"select ProductID, UnitPrice * ( UnitsInStock + UnitsOnOrder ) from Products"
Query1.Add(Products['ProductID']);
Query1.Add(Products,'UnitPrice * (UnitsInStock+UnitsOnOrder)');
There are two ways to use query objects.
One way is executing a query calling the "Calculate" function, which returns a new TDataItem with the query results:
BIGrid1.Data := Query1.Calculate;
Another is using the query object as a "provider" for another TDataItem:
var MyData : TDataItem;
MyData := TDataItem.Create(Query1);
Notes about SQL support:
The default SQL "join" mode is "inner" (intersection). Additional join modes (left, right, full outer) and the SQL "union" modes will be provided in future releases.
The SQL "top" (or "limit") clause can only be specified as integer number of rows using the Max property.
"Top percent" as well as "offset", will be implemented in the future.
Summary
Another key class in TeeBI is the TSummary class, that is more or less equivalent to an "SQL query".
uses BI.Summary;
var S : TSummary;
S:= TSummary.Create;
Similar to TDataSelect queries, when "executing" a TSummary, the resulting output is just another instance of a TDataItem:
var Output : TDataItem;
Output:= S.Calculate;
The "Output" data can be persisted, used anywhere else (grids, charts, etc), and it can even participate in another summary (nested queries).
"Output" can also be sorted and filtered using a TDataCursor like explained in the above pages.
A Summary needs at least one of these two things to generate an output:
- Measure
- GroupBy
A "measure" is an aggregation operation on a data item (like Sum, Average, Min, Max or Count).
We can add as many measures we wish, and each measure can be applied to a simple data column, like:
S.AddMeasure( Orders['Quantity'], TAggregate.Sum );
or an expression can be used to obtain the summarized input:
S.AddMeasure(TDataExpression.FromString(Orders,'Quantity * Products.UnitPrice'),TAggregate.Sum);
Note in the above line of code, the "Products.UnitPrice" refers to another column in another TDataItem table.
TSummary automatically handles data relationships, provided we have the correct Master->Detail link property configured, in this case:
Orders['ProductID]'.Master := Products['ProductID'];
Another internal feature of TSummary is the automatic on-demand generation of "indexes". Indexes are required to quickly search related data items, sort columns, etc.
The AddMeasure method returns an instance of a TMeasure object:
var MyMeasure: TMeasure;
MyMeasure:= S.AddMeasure(...);
TMeasure has two extra properties:
MyMeasure.Missing.AsZero := True; // <-- default value is False
When AsZero is True, aggregations will consider missing (null) values as zeroes instead of skipping them.
Another measure property is "Calculation":
MyMeasure.Calculation.Percentage := TCalculationPercentage.Column; // <-- default is "None"
The "Calculation" property determines if the measure output values should be converted to "Percentages", and / or if values should be accumulated or substracted to obtain "running totals".
MyMeasure.Calculation.Running := TCalculationRunning.Cumulative;
When calculating percentages, the Percentage property can be set to Column, Row or Total to distribute 100% percentages by columns, rows or by "grand total" respectively.
The display format of percentage values in a BIGrid is controlled by the TBIDataset.PercentFormat property (default is "0.00%").
Notes
Count aggregation on "distinct" values is not currently supported. (equivalent to some SQL engines: count(distinct "field") )
The other part of a TSummary are "groupby" definitions:
var ByCategory  : TGroupBy;
ByCategory:= S.AddGroupBy( Products['CategoryID'] );
When using groups, all the measures will be calculated separately for each item belonging to a group.
GroupBy items have several properties to customize them, like "layout":
ByCategory.Layout := TGroupByLayout.Automatic; // <-- default is Automatic
Layout styles
"Rows" layout generates a different row of data for each Category:
ByCategory.Layout := TGroupByLayout.Rows;

"Columns" layout will generate the output with a different column for each "Product Category":
ByCategory.Layout := TGroupByLayout.Columns;

"Automatic" means TSummary will choose itself the "best" combination of "rows" and "columns" for each groupby, for example (using Year and Quarter groups) :
ByCategory.Layout := TGroupByLayout.Automatic;

Automatic is the default layout setting.
Expressions can also be used to "groupby", for example:
S.AddGroupBy(TDataExpression.FromString(Customers,'Length(CompanyName)'));
Date time groups
When using date-time data for grouping, we can specify which part of the date-time we need:
S.AddGroupBy( Orders['OrderDate'] ).DateOptions.Part := TDateTimePart.Month;
Any groupby can be duplicated in the same summary, so we can for example display results grouped by "Month" and by "Year":
S.AddGroupBy( Orders['OrderDate'] ).DateOptions.Part := TDateTimePart.Year;
Numeric groups
When using "continous" data such as float or integer values, TSummary can be configured to group results using an "histogram":
var ByPrice: TGroupBy;
ByPrice:= S.AddGroupBy( Products['Price'] );

// For example we want to split the full "Price" range in 10 groups:
ByPrice.Histogram.NumBins:= 10;

// Or we can define the fixed size for each group:
ByPrice.Histogram.BinSize:= 200;
Other properties of Histogram enable defining the minimum and maximum values for the groups, which are calculated automatically by default.
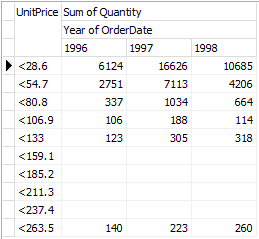
Histogram groupby on "UnitPrice":

Filtering data in Summaries
The TSummary class includes two different data filters:
One is using the Filter property, which is an expression used identically as in TBIDataset or TDataCursor: before calculating the summary aggregations, the Filter expression is evaluated, row by row, and only considers rows that pass the filter.
For example, in the above code that aggregates Orders quantities, we can select only the Order rows that belong to a Customer's Country:
S.Filter:= TDataExpression.FromString(Customers, 'Country = "Mexico" ');
The other one is the Having property, equivalent to the SQL language clause with the same name. This is also an expression like Filter, but its used to select aggregations after the summary has finished calculating everything.
The difference is the Having property allows using summary measure names because they are completely calculated.
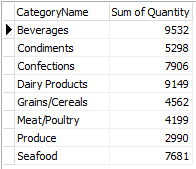
Example, using the above Summary code, only sums bigger than 5000 will be returned:
S.AddMeasure(  Orders['Quantity'], TAggregate.Sum );
S.Having.Add('{Sum of Quantity} > 5000');
S.AddGroupBy( Categories['CategoryName'] );
BIGrid1.Data:= S.Calculate;
Note: A summary can also be used at design-time in high-level mode, clicking the "Data" property of a TBIDataSet, TBIGrid or TBIChart in the Object Inspector.
A design-time editor dialog provides a user interface to define the summary properties and preview the output.
