
Previous | Next
|
|
Contents page Previous | Next |
TeeChart Pro AX v5 includes several new controls that may be added to a project to enhance runtime functionality of a Charting application.
*Note For MS VC++ there are some points that you should take into account when using the additional TeeChart components. Please read the sections below as a general guide and look at the VC++ tutorial for specific VC++ related information.
 |
 |  |  |  |  |
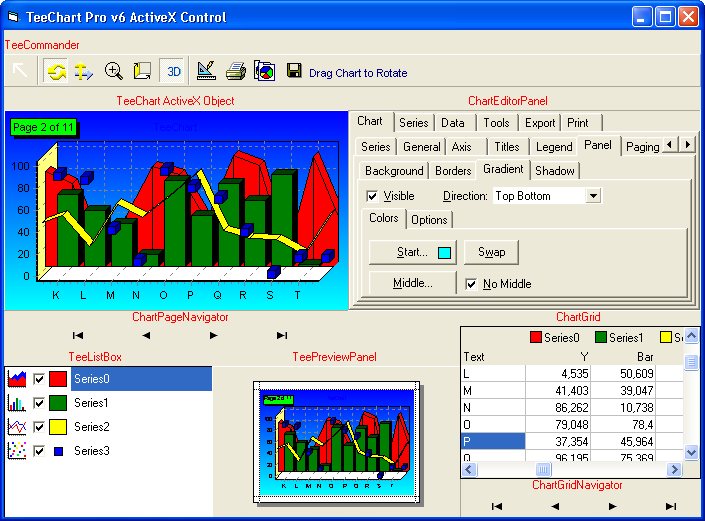
| TeeListBox | TeeEditor | TeePreviewer | TeeCommander | TeePreviewPanel | ChartGrid |
 |  |  |  |  |  |
| ChartGridNavigator | ChartPageNavigator | ChartEditorpanel | SeriesTextSource | SeriesXMLSource | CrossTabSource |
When you add TeeChart Pro to the Visual Basic Component panel the additional controls are automatically added too. For MS VC++, MS J++ and other development environments such as MS Access and Powerbuilder the controls are separately itemised in the Registered Controls list so you will need to select and add them individually.
Associate TeeCommander and the other Non-Chart components with a TChart by using the Chart or ChartLink properties. The Chart property connects directly to the Chart interface which is supported with MS Visual Basic and Internet Explorer. For MS VC++, VJ++, Sybase Powerbuilder and other environments you will need to use the ChartLink property which returns the integer value of the Chart location.
Example
'Visual Basic
TeeCommander1.Chart = TChart1
or
TeeCommander1.ChartLink = TChart1.ChartLink

**** VC++ and other environments ****
eg. MS VC++
m_Commander1.SetChartLink(m_Chart1.GetChartLink());
Visible Components Example
VB Code:
Private Sub Form_Load()
With TChart1
    .AddSeries scArea
    .AddSeries scBar
    .AddSeries scLine
    .AddSeries scPoint
    For i = 0 To 3
        For j = 0 To 100
            .Series(i).AddXY j, Rnd(j) * 100, Chr(65 + j), clTeeColor
        Next j
        .Series(i).Marks.Visible = False
    Next i
    .Page.MaxPointsPerPage = 10
    .Legend.Visible = False
    .Aspect.View3D = True
    .Aspect.Orthogonal = True
    .Panel.Gradient.Visible = True
    .Panel.Gradient.StartColor = vbCyan
    .Panel.Gradient.EndColor = vbBlue
    .Tools.Add tcPageNumber
    With .Tools.Items(0).asPageNum
        .Position = ppLeftTop
        .Shape.Color = vbGreen
    End With
End With
ChartEditorPanel1.Chart = TChart1
ChartGrid1.Chart = TChart1
ChartGridNavigator1.Grid = ChartGrid1
ChartPageNavigator1.Chart = TChart1
TeeCommander1.Chart = TChart1
TeeListBox1.Chart = TChart1
TeePreviewPanel1.Chart = TChart1
End Sub
TeeListBox shows a list of Series in the Chart at runtime. The ListBox may be used to offer the user limited customisation and display/hide of Chart Series.
The TeeEditor component is non visible at runtime. Use the properties of this component to define the runtime Editor displayed to the user. Call the Editor with the ShowEditor method or associate the Editor with the TeeCommander bar to define characteristics of the Editor run from TeeCommander.
The TeePreviewer component is non visible at runtime. Use the properties of this component to define the runtime Previewer displayed to the user. Call the Previewer with the ShowPreviewer method or associate the Previewer with the TeeCommander bar to define characteristics of the Previewer run from TeeCommander.
The TeeCommander bar allows navigation and parameter change control (via the Chart Editor) to be offered to users at runtime. Select the navigation buttons and with the left mouse button depressed, drag over the Chart panel to move the Chart. The EditorLink and PreviewerLink properties may be used to associate the runtime properties defined by those 2 components to the characteristics of the Chart Editor and Previwer when called from TeeCommander.
The TeePreviewPanel allows the visualisation of your Chart on a printed page at runtime. The Chart's margins can be dragged to the desired position.
The ChartGrid shows the data in all the Chart's series. This data may be modified directly via Grid and the Grid itself may be associated with a ChartGridNavigator for easy reading.
The ChartGridNavigator, when associated with a ChartGrid via the Grid property, allows easy reading of and navigation through the ChartGrid.
The ChartPageNavigator facilitates the visualisation of a multi-page Chart when it is associated to one via the Chart property.
The ChartEditorPanel displays the Chart Editor at run-time in a Panel on your form or HTML page.
The SeriesTextSource is non-visible at run-time. It allows data to be brought in from text files to specified Chart series. Use this compenent's methods and properties to define or modify the data's fields and field delimiters and to set the location of the textfile as a path, URL or stream.
Example
TChart1.AddSeries(scSurface)
With SeriesTextSource1

  ' AddField AName refers to the Series ValueList name
  ' The AIndex refers to the Column index of the text file
  ' beginning with Column 1
  .AddField "X", 1
  .AddField "Y", 2
  .AddField "Z", 3

  ' Check for locale decimal separator on PC
  ' and import formetted textfile accordingly
  If CInt("5,3") < CInt("5.3") Then
    .FileName = App.Path & "\SampleData.txt"
  Else
    .FileName = App.Path & "\SampleDataPoint.txt"
  End If

  .Series = TChart1.Series(0)

  ' or Series may be passed as Index but you would then
  ' have to set the Chart for the source
  'eg.
  ' .Chart = TChart1
  ' .Series = 0

  .Active = True
End With
The SeriesTextSource is non-visible at run-time. It allows data to be brought in from XML files to specified Chart series. Use this compenent's methods and properties to define or modify the data's fields and field delimiters and to set the location of the XML file as a path, URL or stream.
Example
Private Sub Form_Load()
TChart1.AddSeries scBar
With SeriesXMLSource1
    .FileName = "http://www.steema.com/SampleData.xml" 'This can also be a local file
    .Series = TChart1.Series(0)
    .SeriesNode = "USA"
    .ValueSource = "Bar"
    .Open
End With
End Sub
The CrossTabSource is non-visible at run-time. CrossTabSource component connects to any dataset and automatically creates series from database data, using Group and Label fields and formula (sum or count values).
Example
Private Sub Command1_Click()
Dim tmp As String
With CrossTabSource1
    tmp = .GroupField
    .GroupField = .LabelField
    .LabelField = tmp
    .Active = True
End With
TChart1.RefreshData
End Sub

Private Sub Form_Load()
TChart1.AddSeries scBar
With CrossTabSource1
    .Series = TChart1.Series(0)
    .GroupField = "Terms"
    .LabelField = "Paymtype"
    .ValueField = "Amntpaid"
    .DataSet = "DSN=TeeChart Pro System db; SQL=select * from orders"
    .Active = True
End With
TChart1.RefreshData
End Sub
 |
 |