
Previous
|
|
Contents page Previous |
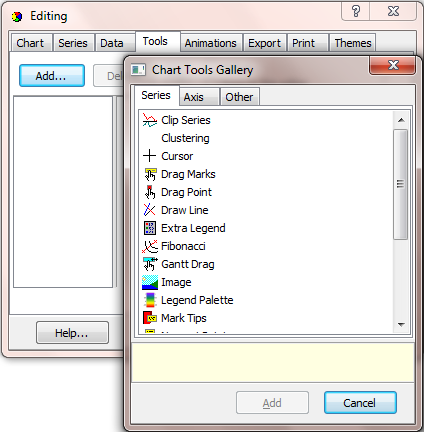
At design-time these Tools are added by clicking on the Add... button of the Tools Tab within the Chart Editor:
At run-time only a few simple lines of code are necessary.
The Annotation Tool allows text to be displayed on the Chart.
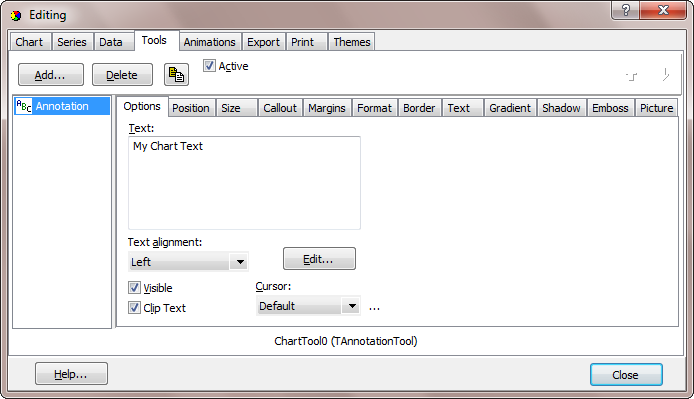
The Text of the Annotation Tool and the box it sits in can both be fully configured. The Options tab allows you to enter the text you wish and to specify its alignment and the cursor type that appear when the mouse is over the Tool. The Position tab specifies the default or custom position of the Annotation Tool. The Callout tab defines the Annotation Tool's Callout object which is used to draw a line from the annotation to any position in the chart. The Format tab configures the text box, allowing you to change its colour, frame, pattern, bevel, size, roundness and transparency. The Text tab enables the setting of the text font, colour, outline and spacing and also the colour and size of the text shadow. The Gradient tab configures the properties of the text-box gradient while the Shadow tab configures the properties of the text-box shadow.
Adding an Annotation Tool at runtime is a straightforward operation, as can be seen in the example below:
With TChart1
    .Tools.Add tcAnnotate
    With .Tools.Items(0)
        .Active = True
        With .asAnnotation
          .Position = ppLeftTop
          .Shape.ShapeStyle = fosRoundRectangle
          .Shape.Font.Color = vbCyan
          .Text = "My Chart text"
        End with
    End With
End With
The Axis Arrow Tool displays configurable arrows at the beginning and end of axes. These arrows can be made to scroll the axes when clicked upon.
Once you have added an Arrow Tool a number of options become open to you. Axis enables to to select the axis (top, bottom, left, right or custom) to which you want to associate the Axis Tool. You may add more than one Axis Tool and associate each one with different axes. Border allows you to configure the style, colour, width and visibility of the pen outlining the arrow shape while Pattern allows you to configure the body of the arrow, it's colour, pattern or fill-image. Length descibes the length of the arrow in pixels, Position defines whether the arrows are drawn on the End, Start or at Both ends of the axis while Scroll defines the percentage of the axis length by which the axis will scroll when the arrows are clicked. Inverted Scroll will change the scroll direction.
Adding an Axis Arrow Tool at runtime is a straightforward operation, as can be seen in the example below. Please note that the 3 in .Axis refers to the right axis; 0 refers to the bottom axis, 1 to the top axis, 2 to the left axis and 4 would refer to the first Custom axis (Custom 0), 5 to the second (Custom 1) etc.
Example
With TChart1
    .Tools.Add tcAxisArrow
    With .Tools.Items(0)
        .Active = True
        With .asAxisArrow
          .Axis = 3
          .Brush.Color = vbCyan
          .Length = 20
          .Pen.Color = vbRed
          .Pen.Width = 2
          .Position = aaBoth
          .ScrollPercent = 20
        End with
    End With
End With
The Color Band Tool adds bands of configurable color to the interior region enclosed by the Chart axes. These bands may be set vertically or horizontally in line with the axis values.
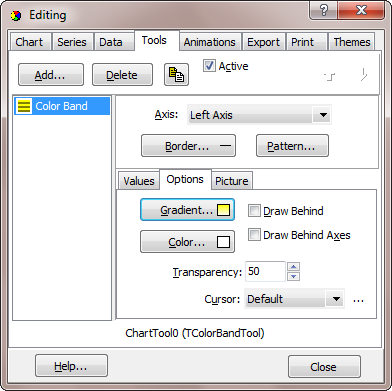
There are a number of options to be able to configure the Color Band Tool once it's been added to your chart. Axis enables to to select the axis (top, bottom, left, right or custom) to which you want to associate the Color Band. Border allows you to configure the style, colour, width and visibility of the pen outlining the Color Band while Pattern allows you to configure the body of the Color Band, the pattern and its colour or fill-image. Gradient defines the visibility, direction and start, middle and end colours of the Color Band Gradient while Color, in the absence of a gradient or an image, defines the colour. Start value sets the start value on the specified axis from which the Color Band Tool will begin and End value sets the end value. Transparency is a value from 0 to 100 which sets the transparency of the Color Band Tool while Draw Behind enables/disables the drawing of it behind the Chart series.
Adding an Color Band Tool at runtime is a straightforward operation, as can be seen in the example below:
Example
The Color Band Tool is very useful for highlighting a specific set of values within your series. In this example we are using a Color Band Tool which extends between the YValues of 20 and 60 and whose transparency can be altered by the Scroll Bar. Color Bands can be drawn in front of or behind your TeeChart series.

Private Sub Check1_Click()
  TChart1.Tools.Items(0).asColorband.DrawBehind = Check1.Value
End Sub

Private Sub Form_Load()
  With TChart1
    .Aspect.View3D = False
    .Panel.Gradient.Visible = True
    .Panel.Gradient.MidColor = vbGray
    .AddSeries scArea
    .Series(0).asArea.LinePen.Color = vbBlue
    For i = 0 To 10
        .Series(0).AddXY i, Rnd(i) * 100, "", clTeeColor
    Next i
    .Tools.Add tcColorband
    .Tools.Items(0).Active = True
    With .Tools.Items(0).asColorband
      .Axis = 0
      .Transparency = 50
      .EndValue = 60
      .StartValue = 20
      .DrawBehind = False
    End With
    End With
    Check1.Caption = "Draw Behind"
    Check1.Value = 0
    HScroll1.Min = 0
    HScroll1.Max = 100
    HScroll1.Value = 50
End Sub

Private Sub HScroll1_Change()
  TChart1.Tools.Items(0).asColorband.Transparency = HScroll1.Value
End Sub

Private Sub HScroll1_Scroll()
  HScroll1_Change
End Sub
The Color Line Tool adds colored lines to the Chart which can be set vertically or horizontally in line with the axis values.
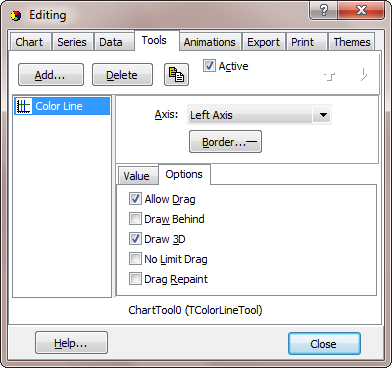
ColorLines can be associated with a specific Axis at a specific series Value while the style, colour, width and visibility of the ColorLine can be configured with Border. The Value Tab defines the custom and default Color Line Tool postions and the Options Tab specifies the ColorLine Tool options.
Adding an Color Line Tool at runtime is a straightforward operation, as can be seen in the example below:
Example
With TChart1
    .Tools.Add tcColorLine
    With .Tools.Items(0)
        .Active = True
        With .asColorLine
          .AllowDrag = True
          .Axis = 2
          .Pen.Color = vbBlue
          .Value = 100
        End with
    End With
End With
The Cursor Tool adds cursors to the Chart which can be associated with individual series or with the Chart as a whole. Cursors may be horizontal, vertical or both (crosshair).
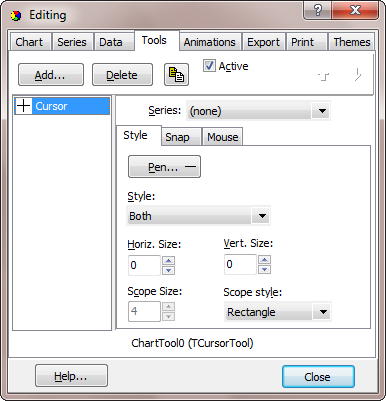
Once added, Cursor tools may or may not be associated with a Chart Series and may be configured in Style as being horizontal, vertical or both. If a Cursor Tool is associated with a series then it can be set to Snap to the series YValues as the cursor is moved. Follow Mouse causes the Cursor Tool to move with the mouse while Pen configures the colour, width, style and visibility of the Cursor Tool lines themselves.
Adding a Cursor Tool at runtime is a straightforward operation, as can be seen in the example below:
Example
With TChart1
    .Tools.Add tcCursor
    With .Tools.Items(0)
        .Active = True
        With .asTeeCursor
          .FollowMouse = True
          .Series = 0
          .Style = cssBoth
          .XValue = 4
          .YValue = 100
        End with
    End With
End With
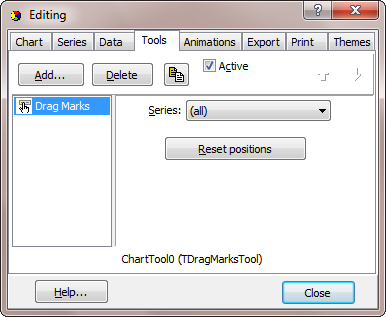
The Drag Marks Tool allows the mousedrag of Marks for the selected Series.
Adding a Drag Marks Tool at runtime is a straightforward operation, as can be seen in the example below:
Example
With TChart1
    .Tools.Add tcDragMarks
    With .Tools.Items(0)
        .Active = True
        .asDragMark.Series = 0
    End With
End With
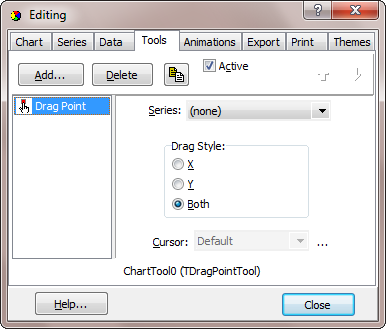
The Drag Point Tool allows the mousedrag of Series points for the selected or all Series.
Adding a Drag Point Tool at runtime is a straightforward operation, as can be seen in the example below:
Example
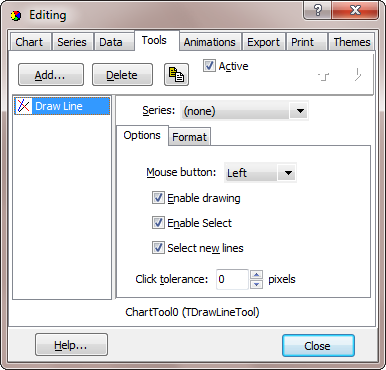
The Draw Line Tool enables fully customisable lines to be drawn, selected, dragged and deleted on the Chart with the mouse.
Adding a Draw Line Tool at runtime is a straightforward operation, as can be seen in the example below:
Example
With TChart1
    .Tools.Add tcDrawLine
    With .Tools.Items(0)
        .Active = True
        With .asDrawLine
          .Button = mbLeft
          .EnableDraw = True
          .EnableSelect = True
          .Series = 0
          .Pen.Color = vbCyan
        End with
    End With
End With
The Extra Legend Tool allows a fully customisable extra legend to be drawn anywhere on the Chart canvas.
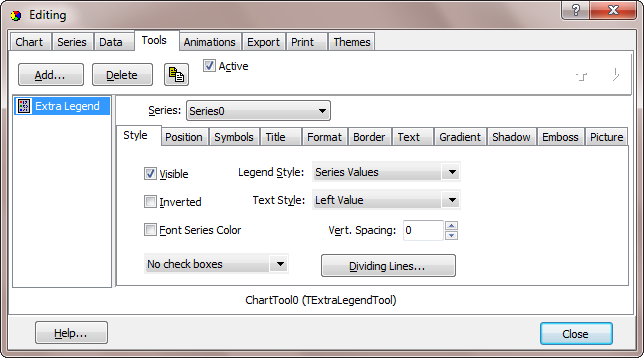
The Extra Legend Tool has to set to a specific Series for it to appear. The Edit Legend button gives access to a Legend Editor which allows the Extra Legend's Style, Position, Symbols, Format, Text, Gradient and Shadow to be configured.
Adding a Extra Legend Tool at runtime is a straightforward operation, as can be seen in the example below:
Example
Private Sub Form_Load()
With TChart1
    .AddSeries scBar
    .Series(0).FillSampleValues 6
    .AddSeries scBar
    .Series(1).FillSampleValues 6
    .Legend.LegendStyle = lsValues
    .Environment.InternalRepaint
    .Tools.Add tcExtraLegend
    With .Tools.Items(0).asExtraLegend
        .Series = TChart1.Series(1)
        .Legend.CustomPosition = True
        .Legend.Left = TChart1.Legend.ShapeBounds.Left
        .Legend.Top = TChart1.Legend.ShapeBounds.Bottom + 10
    End With
End With
End Sub
The Gantt Drag Tool enables the bars of Gantt Series to be dragged and/or resized.
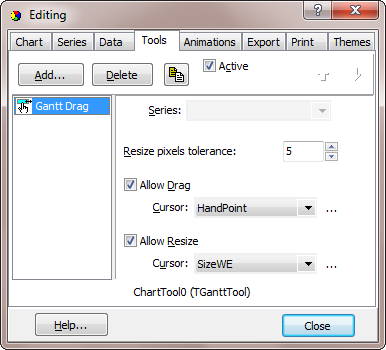
The Gantt Drag Tool has to set to a specific Gantt Series for it to appear. Pixel resize tolerance specifies the minimum number a pixels a Gantt bar will be moved/resized, Allow Drag enables/disables the dragging of Gantt bars, Allow Resize enables/disables the resizing of Gantt bars while Cursor sets the mouse cursor that will appear during the respective operations.
Adding a Extra Legend Tool at runtime is a straightforward operation, as can be seen in the example below:
Example
Private Sub Form_Load()
TChart1.Aspect.View3D = False
TChart1.AddSeries scGantt
TChart1.Series(0).XValues.Order = loNone

With TChart1.Series(0)
    .asGantt.AddGantt DateSerial(2017, 4, 1), DateSerial(2017, 4, 10), 0, "A"
    .asGantt.AddGantt DateSerial(2017, 4, 5), DateSerial(2017, 4, 15), 1, "B"
    .asGantt.AddGantt DateSerial(2017, 4, 2), DateSerial(2017, 4, 8), 2, "C"
    .asGantt.AddGantt DateSerial(2017, 4, 9), DateSerial(2017, 4, 21), 3, "D"
    .Marks.Visible = True
    .Marks.ShadowSize = 0
    .Marks.Gradient.Visible = True
End With

TChart1.Axis.Bottom.SetMinMax DateSerial(2017, 4, 1), DateSerial(2017, 5, 1)
TChart1.Axis.Left.SetMinMax -2, 5
TChart1.Axis.Left.GridCentered = False
TChart1.Zoom.Enable = False
TChart1.Axis.Bottom.Increment = TChart1.GetDateTimeStep(dtOneDay)
TChart1.Axis.Bottom.Labels.Angle = 90
TChart1.Axis.Bottom.Labels.DateTimeFormat = "dd-mmm"
TChart1.Tools.Add tcGantt
TChart1.Tools.Items(0).asGantt.Series = TChart1.Series(0)
TChart1.Tools.Items(0).Active = True
End Sub

Private Sub TChart1_OnGanttToolDragBar(ByVal Tool As Long, ByVal GanttBar As Long)
With TChart1.Tools.Items(0).asGantt.Gantt
    Label1.Caption = FormatDateTime(.StartValues.Value(GanttBar)) + " - " + _
                    FormatDateTime(.EndValues.Value(GanttBar))
End With
End Sub

Private Sub TChart1_OnGanttToolResizeBar(ByVal Tool As Long, ByVal GanttBar As Long, ByVal BarPart As TeeChart.EGanttToolPartBar)
With TChart1.Tools.Items(0).asGantt.Gantt
    Label1.Caption = FormatDateTime(.StartValues.Value(GanttBar)) + " - " + _
                    FormatDateTime(.EndValues.Value(GanttBar))
End With
End Sub

Private Sub TChart1_OnGetSeriesMark(ByVal SeriesIndex As Long, ByVal ValueIndex As Long, MarkText As String)
Select Case ValueIndex
    Case 0: MarkText = "John"
    Case 1: MarkText = "Ann"
    Case 2: MarkText = "David"
    Case 3: MarkText = "Carol"
End Select
End Sub

Private Sub TChart1_OnMouseUp(ByVal Button As TeeChart.EMouseButton, ByVal Shift As TeeChart.EShiftState, ByVal x As Long, ByVal y As Long)
    Label1.Caption = ""
End Sub
The Grid Band Tool adds fully configurable bands of color to the grids of a defined axis.

The Grid Band Tool has to be associated with a specified Axis. Band 1 and Band 2 define the Brush characteristics for the the two bands, while Back defines the back color which shows through if the Band has a patterned Brush. Transparency sets the transparency level for each respective Band.
Adding an Grid Band Tool at runtime is a straightforward operation, as can be seen in the example below:
Example
Private Sub Form_Load()
With TChart1
    .AddSeries scBar
    .Series(0).FillSampleValues 6

    .Tools.Add tcGridBand
    With .Tools.Items(0).asGridBand
        .Axis = TChart1.Axis.Left
        .Band1.Color = vbGreen
        .Band2.Color = vbBlue
    End With
End With
End Sub
The 3D Grid Transpose Tool exchanges X and Z coordinates to rotate a Grid-based series through 90 degrees.
The 3D Grid Transpose Tool has to be associated with a specified Grid 3D Series. Transpose now will perform the Transpose operation at design time.
Adding an Grid Transpose Tool at runtime is a straightforward operation, as can be seen in the example below:
Example
Private Sub Command1_Click()
With TChart1.Tools.Items(0).asGridTranspose
        .Transpose
    End With
End Sub

Private Sub Form_Load()
With TChart1
    .AddSeries scSurface
    .Series(0).FillSampleValues 20

    .Tools.Add tcGridTranspose
    With .Tools.Items(0).asGridTranspose
        .Series = TChart1.Series(0)
    End With
End With
End Sub
The Image Tool draws a picture (bitmap, jpeg, gif, pcx) behind a specified chart Series.
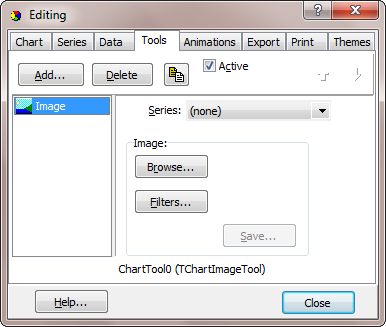
The Image Tool can be associated with a specific Series or can be left at default associated with none of the Chart series. Using Image one can browse for or clear images of all formats.
Adding an Image Tool at runtime is a straightforward operation, as can be seen in the example below:
Example
With TChart1
    .Tools.Add tcChartImage
    With .Tools.Items(0)
        .Active = True
        .asChartImage.ImageLoad "C:\TestImages\MyImage.jpg"
    End With
End With
The Marks Tip tool is used to display default Hint windows when the mouse is over (or clicks) a Series point.
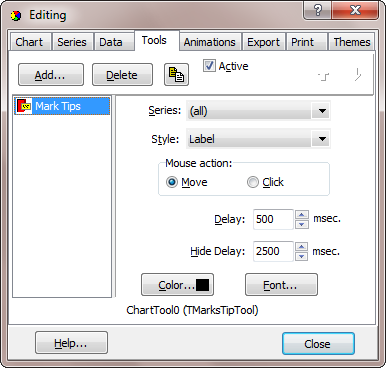
The Mark Tips Tool can be associated with a specific Series or can be left at default associated with none of the Chart series. Style defines the type of series data to be displayed in the Mark Tips while Mouse Action sets whether the Mark Tips appear on a Mouse click or move. Delay desfines the lapse of time in milliseconds before the Mark Tips appear.
Adding a Mark Tips Tool at runtime is a straightforward operation, as can be seen in the example below:
Example
With TChart1
    .Tools.Add tcMarksTip
    With .Tools.Items(0)
        .Active = True
        With .asMarksTip
          .Delay = 1000
          .MouseAction = mtmMove
          .Series = 0
          .Style = smsXY
        End with
    End With
End With
The Nearest Point Tool moves a marker to the point nearest to the cursor. The tool may be associated with a Series or applied globally to the Chart.
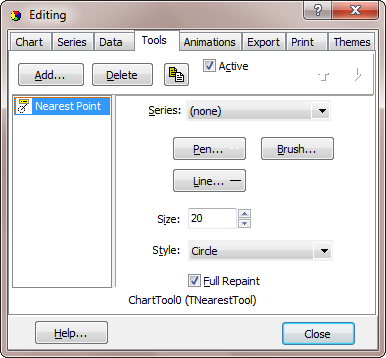
The Nearest Point Tool needs to be associated with a specific Chart Series. Its appearance can be configured using Pen to define the colour, style, width and visibility of the lines used to draw the Tool and Brush to define the colour and pattern or image used to fill the Tool's area. Draw Line enables/disables the drawing of the connecting line between the cursor position and the Nearest Point Tool shape, Size defines the size of this shape while Style defines the type of shape used.
Adding a Nearest Point Tool at runtime is a straightforward operation, as can be seen in the example below:
Example
With TChart1
    .Tools.Add tcNearest
    With .Tools.Items(0)
        .Active = True
        With .asNearest
          .DrawLine = True
          .Pen.Color = vbBlue
          .Series = 1
          .Size = 20
          .Style = hsDiamond
        End with
    End With
End With
The Page Number Tool displays a fully configurable text box containing a chosen page numbering system.
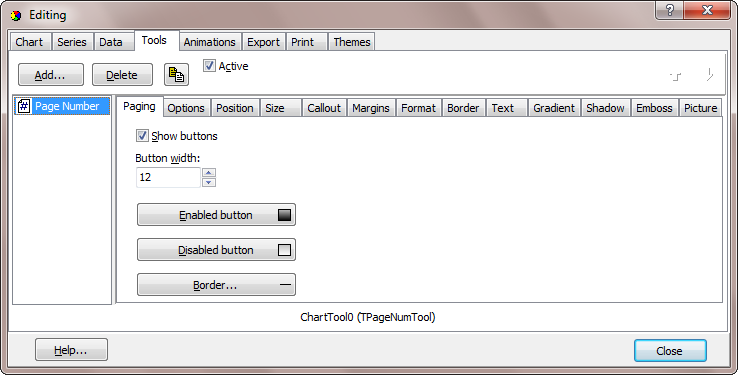
The Text of the Page Number Tool and the box it sits in can both be fully configured. The Options tab allows you to enter the text you wish and to specify its alignment and the cursor type that appear when the mouse is over the Tool. The Position tab specifies the default or custom position of the Page Number Tool. The Callout tab defines the Page Number Tool's Callout object which is used to draw a line from the annotation to any position in the chart. The Format tab configures the text box, allowing you to change its colour, frame, pattern, bevel, size, roundness and transparency. The Text tab enables the setting of the text font, colour, outline and spacing and also the colour and size of the text shadow. The Gradient tab configures the properties of the text-box gradient while the Shadow tab configures the properties of the text-box shadow.
Adding a Page Number Tool at runtime is a straightforward operation, as can be seen in the example below:
Example
With TChart1
    .Tools.Add tcPageNumber
    With .Tools.Items(0)
        .Active = True
        .asPageNum.Position = ppRightTop
        .asPageNum.Shape.Gradient.Visible = True
    End With
End With
The Pie Slices Tool highlights the pie slice under the mouse either by drawing a border around it or by exploding it away from the rest of the Pie Series.
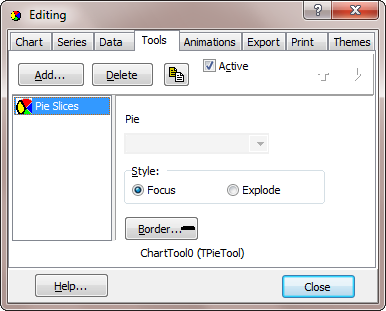
The Pie Slices Tool has to be associated with a specific Pie Series before it will appear. Style specifies whether the tool will focus on the pie slice the mouse is over or whether it will explode it away from the rest. Border specifies the pen characteristics of the border which is drawn around a focussed pie slice.
Adding a Pie Slices Tool at runtime is a straightforward operation, as can be seen in the example below:
Example
With TChart1
    .Aspect.View3D = False
    .AddSeries scPie
    .Series(0).asPie.Circled = False
    .Series(0).FillSampleValues 6

    .Tools.Add tcPie
    With .Tools.Items(0).asPie
        .Series = TChart1.Series(0)
        .Style = ptFocus
    End With
End With
The Rotate tool changes the elevation and rotation of charts when dragging the mouse over a chart.
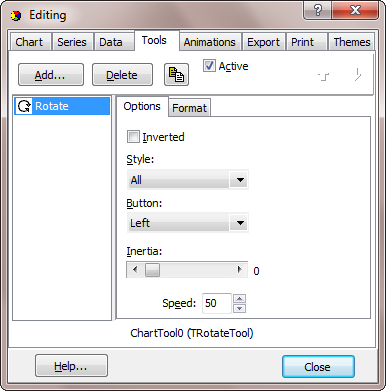
Rotate Tool designtime configurable properties include Inverted inverts the effect of mouse movement while rotating the chart, Style specifies whether the Chart is rotated, elevated or both, Button specifies which mouse button is used to rotate the chart while Outline configures the chart outline which can be drawn while the specified mouse button is being moved.
Adding a Rotate Tool at runtime is a straightforward operation, as can be seen in the example below:
Example
With TChart1
    .Tools.Add tcRotate
    With .Tools.Items(0)
        .Active = True
        .asRotate.Button = mbRight
    End With
End With
The Series Animation Tool performs a growing animation of Series Points.
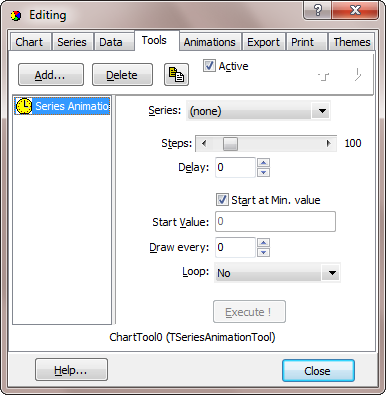
The Series Animation Tool has to be associated with a particular Series. Steps defines the number of animation steps taken by the Series Animation Tool, Start at Min value will start the animation from the minium Series YValue while Start Value specifies the start value when Start at Min value is set to false. Draw every will draw the series in groups of n points.
Please find following a working example of the Series Animation Tool:
Example
Private Sub Command1_Click()
On Error Resume Next
HScroll1.Enabled = False
Command1.Enabled = False
TChart1.Tools.Items(0).asSeriesAnimation.Execute
HScroll1.Enabled = True
Command1.Enabled = True
End Sub

Private Sub Command2_Click()
TChart1.Tools.Items(0).ShowEditor
HScroll1.Value = TChart1.Tools.Items(0).asSeriesAnimation.Steps
End Sub

Private Sub Check1_Click()
  If Check1.Value = 1 Then
     TChart1.Tools.Items(0).asSeriesAnimation.DrawEvery = 1
  Else
     TChart1.Tools.Items(0).asSeriesAnimation.DrawEvery = 0
  End If
End Sub

Private Sub Form_Load()
TChart1.AddSeries scBar
TChart1.Series(0).ColorEachPoint = True
TChart1.Tools.Add tcSeriesAnimation
HScroll1.Min = 1
HScroll1.Max = 255
HScroll1.Value = 100

TChart1.Series(0).FillSampleValues 6
TChart1.Legend.Visible = False
TChart1.Series(0).ValueFormat = "000"
TChart1.Tools.Items(0).asSeriesAnimation.Series = TChart1.Series(0)
TChart1.Tools.Items(0).asSeriesAnimation.StartAtMin = False
End Sub

Private Sub HScroll1_Change()
TChart1.Tools.Items(0).asSeriesAnimation.Steps = HScroll1.Value
Label2.Caption = HScroll1.Value
End Sub

Private Sub HScroll1_Scroll()
Label2.Caption = HScroll1.Value
End Sub

Private Sub TChart1_OnSeriesAnimationToolStep(ByVal Tool As Long, ByVal Step As Long)
If Tool = 0 Then
    With TChart1
        .Series(0).PointColor(0) = RGB(255 - Step, Step, Step)
        .Series(0).PointColor(1) = RGB(Step, 255 - Step, Step)
        .Series(0).PointColor(2) = RGB(Step, Step, 255 - Step)
        .Series(0).PointColor(3) = RGB(255 - Step, 255 - Step, Step)
        .Series(0).PointColor(4) = RGB(Step, 255 - Step, 255 - Step)
        .Series(0).PointColor(5) = RGB(255 - Step, Step, 255 - Step)
    End With
End If
End Sub
 |