 |
See TChartShape for a full list of properties and methods
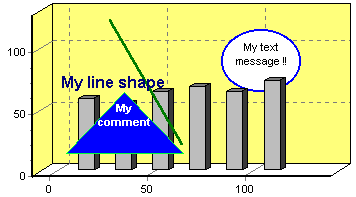
Shape Series are useful for defining or adding any additional information to your Chart, perhaps in runtime as a result of receipt of exceptional data. You may add text to any shape you add to your Chart and relate the shape to another Series.
| Shape Series |  |
Each shape has two co-ordinates associated with it, top left and bottom right of the invisible rectangle that encloses the shape. You may add text to the box. These co-ordinates and messages could be updated at runtime by your code to dynamically put the shapes anywhere on your Chart.