 |
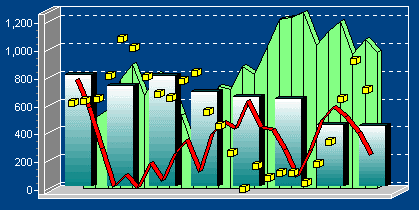
There is no practical limit to the number of Series that you can add concurrently to your Chart.
You may mix different Series types, almost any Series type with any other Series type. For certain combinations it is not practical as axis definition between Series may directly conflict. For those cases the Series not available are greyed out in the Series gallery so that you cannot mistakenly select them.
See the section on functions for more about combining Series types. Functions work with other Series to create and display algorithmic relationships.
| Combining Series |  |
Example Series combination
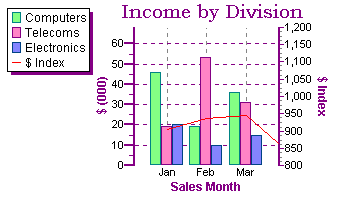
Combining Seriestypes in one Chart can add a great deal of information value. The following example shows the incomes by Division and puts the $ index in the same Chart to measure the effect of that external influence on incomes (perhaps no influence at all in this example !!).
| 2D Combining Series types |  |
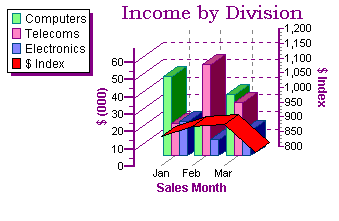
You may combine Series in 3D Charts. The previous example is represented in 3D below. The Chart looks attractive although a high degree of 3D perspective makes it more difficult to visualise the monthly $ index with Division incomes.
| 3D combining Series types (60% 3D) |  |
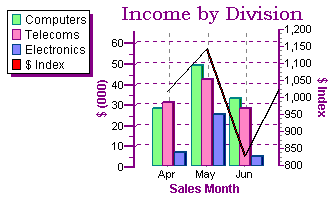
You could minimise the effect by reducing the extent of ‘side’ view (percentage 3D).
| 3D combining Series types (6% 3D) |  |
Or you could modify code so that at runtime the Chart will put all Series in the same Z-plane. 3D Charts have a property called Z-Order (see figure) which controls the depth position of each Series.

It is possible to put all Series on the same plane although we advise caution as the effect may be confusing depending on which Series types you are combining.
The following line of code (name of Chart here Chart1) will put all Series in the same Z plane:
Chart1.ApplyZOrder:=False;