
 |
Add
See TAddTeeFunction for a full list of properties and methods
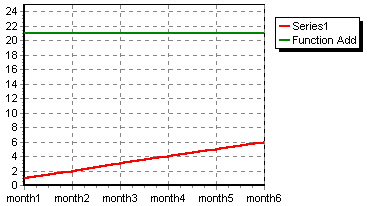
The Add function adds data from one or more Series. If we create a line Series ‘Series1’, create a line Series ‘Function Add’ and define Series ‘Function Add’ as Add of Series1 and do nothing more we will obtain a Chart with Series1 displayed and ‘Function Add’ as one flat line which is the sum of all values of Series1. In the figure the total of 1 + 2 + 3 + 4 + 5 + 6 = 21.
| Fig. 1.
2D Add function with 1 Series input |
 |
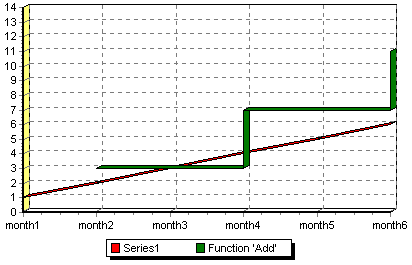
We can modify the Series ‘Function Add’ to represent Add of Series1 by 2 point groupings (1+2), (3+4), (5+6). We use the period property (Chart Editor in the Data source page). Coded it looks like this:
Series2.FunctionType.Period:=2;

{where Series2 is the functionSeries}
Alternatively:
TeeFunction1.Period:=2;
{The name of the function is automatically allocated when the function is defined in the Chart editor - You will find it in the Object inspector}
Defining the period as 2, sets the Add function to add every 2 points. The period property adds enormous value to function Series.
| Fig. 2.
Add function with period = 2 |
 |
Subtract
See TSubtractTeeFunction for a full list of properties and methods
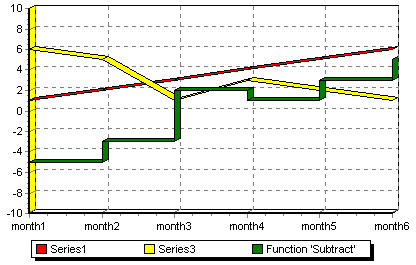
Subtract requires 2 input Series. With more than one Series in the function the default period sets to 1 axis point. the 2nd Series will be subtracted from the 1st Series in the list.
The following Chart is defined with ApplyZOrder:=False which forces all Series to draw in the same 3-Dimensional plane - The resulting Series overlay (a sort of optical illusion) in the Chart depends on the Series paint order.
| Fig. 3.
Subtract function |
 |
Multiply
See TMultiplyTeeFunction for a full list of properties and methods
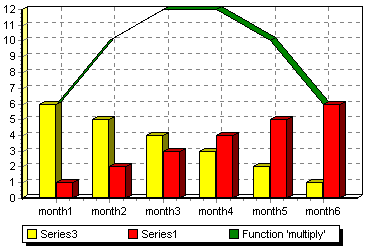
The default period for the function ‘multiply’ is 1. You may add as many Series as you wish to the multiply function.
| Fig. 4.
Multiply function |
 |
Divide
See TDivideTeeFunction for a full list of properties and methods
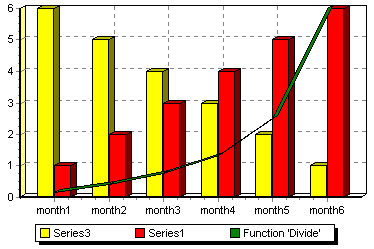
As divide requires at least 2 input Series the default period for the divide function is 1. The 2nd Series in the list is the denominator.
If you add more than 2 Series then the 1st will be divided by the 2nd then that is divided by the third, etc.…
| Fig. 5.
Divide function |
 |
High
See THighTeeFunction for a full list of properties and methods
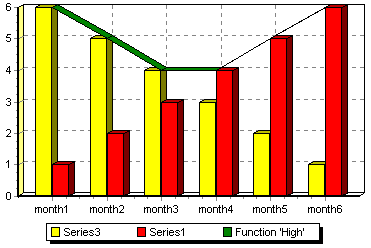
High accepts multiple input Series and will always display the highest point between those Series at each period point. (1 Series default period 0, 2 or more Series default period 1).
| Fig. 6.
High function |
 |
Low
See TLowTeeFunction for a full list of properties and methods
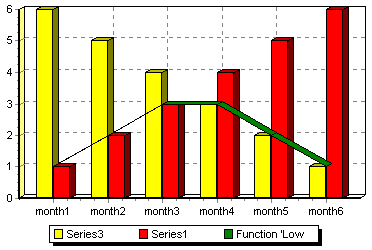
Low accepts multiple input Series. It will always display the lowest point between those Series at each period point. (1 Series default period 0, 2 or more Series default period 1).
| Fig. 7.
Low function |
 |
Average
See TAverageTeeFunction for a full list of properties and methods
| Fig. 8.
Average function |
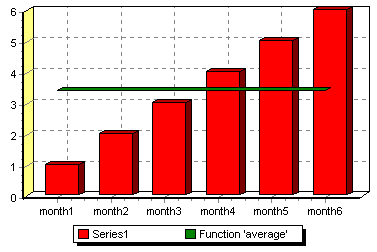 |
The default period for average with one Series is 0 (all) which will give you the average for that Series across the whole Chart. If you have more than one Series the period will be 1 axis point.
You may change the period to alter the frequency of the average curve.