 |
See TGanttSeries for a full list of properties and methods
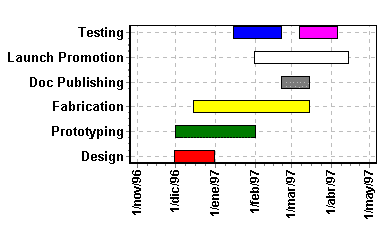
Use the Gantt Chart as a planner or to track progress of a project or Series of activities.
The Gantt Series draws bars that have start and end values which may be of datetime format. You may define a Y axis value for the vertical position of the bar and you may define ‘next bar’ to draw connection lines between the bars.
| 2D Chart with a Gantt Series. |  |
How to add Gantt bars manually
Use the AddGantt or AddGanttColor methods.
Example:
   GanttSeries1.AddGantt(  EncodeDate( 2000, 1,  1 ),
                           EncodeDate( 2000, 1, 31 ),
                           0,
                           'Programming' );
Or...
   GanttSeries1.AddGanttColor(EncodeDate( 2000,1,1 ),
                              EncodeDate( 2000,1,31),
                                0, 'Programming',
                                clGreen );
Where "0" is the desired vertical position for this bar.
Choose the vertical position you prefer.
To connect gantt bars:
1) Store the "AddGantt" or "AddGanttColor" function return longint:
Var tmp1, tmp2 : Longint;

tmp1:=GanttSeries1.AddGantt(EncodeDate(2000,1,1 ),
                            EncodeDate( 2000,1,31 ),
                               0,'Programming' );

tmp2:=GanttSeries1.AddGantt(  EncodeDate( 2000,4,1 ),
                              EncodeDate( 2000,4,30),
                               0, 'Testing' );
2) Then use the NextTask property:
GanttSeries1.NextTask[ tmp1 ] := tmp2 ;This will draw a line from 'Programming' gantt bar to 'Testing' bar. The "ConnectingLinePen" property is the pen used to draw lines.