

|
See TBarSeries for a full list of properties and methods
The bar Series in 2 or 3 dimensions doesn’t have to be represented by a rectangular bar -
| Choose a barstyle for your Chart Series or ‘mix and match’ to suit your needs. | 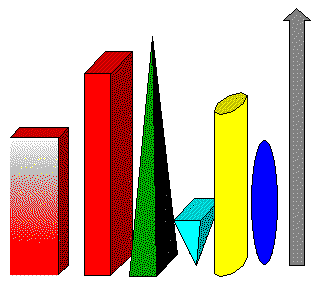 |
Example bar Series configuration
Mixing bar Series styles may be useful for some applications. Below is an example stacked bar Chart.
| Mixed bartypes | 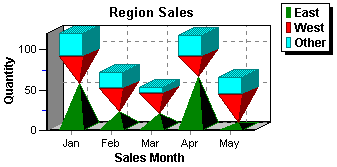 |
Steps taken to build this demo Chart and populate it with data are as follows:
1. Drag a Chart component onto your form and drag it out to the size you want.
2. Click the right mouse button over the Chart and select editor from the menu.
Add 3 bar Series and give them individual titles using Title on the first editor screen (titles in our example ‘East’ ‘West’ and ‘Other’).
Select Multi Bar and set as stacked in the Format page of any one of the 3 Series (The change will apply to all 3 Series).
Add a title using the entry tab for ‘Titles’ in the Chart page of the editor.
Go to the axis tab. Select Left axis and add the title. We allowed the axis to automatically size itself but took minor ticks off on the bottom axis.
Each Series has a different shape defined for its bars. We define the shape individually in the configuration page of each barSeries. The first tab, Format, has the option for Style.
You could code the style with:
East.BarStyle:= bsPyramid ;
West.BarStyle:= bsInvPyramid ;
Other.BarStyle:= bsRectangle ;
Lookup BarStyle in the TeeChart online help to get the full list of options.
For this Chart it would be necessary to control the Series order to achieve the correct effect. This can be done in the Chart Editor at design time by selecting the Series in the Series list of the Chart page and using the arrows to change the order. At runtime we can achieve the same with the following code:
Drawing order is always based on the order for which the Series are assigned to ParentChart.
The order can be altered at run-time via the Serieslist property:
Chart1.SeriesList[ 0 ] := East;
Chart1.SeriesList[ 1 ] := West;
Chart1.SeriesList[ 2] := Other;
We added some random values to populate this demo. We could launch the code at form creation or put a button on the form to run the code.
procedure OurForm.Button2Click(Sender: TObject);
var t:integer;
begin
  Randomize;
  with East do
    for t:=1 to 12 do AddY( Random(70),     ShortMonthNames[t],clTeeColor);
  with West do
    for t:=1 to 12 do AddY( Random(70), ShortMonthNames[t],clTeeColor);
  with Other do
    for t:=1 to 12 do AddY( Random(30), ShortMonthNames[t],clTeeColor);
end;
We populated the data for 12 months but are showing only 5 months. The Paging tab in the Chart page of the editor has the definition of points per page.
Bar Series display
The Multi Bar parameter set in the Format tab of the Series page for one of the bar Series sets the display alignment of the bars for each bar Series in the Chart. - It is not necessary to go to each bar Series to change the parameter.
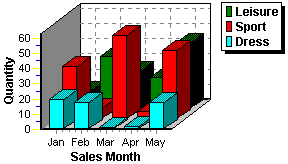
The following figure shows different formats to display bar Series. Each Chart has the same information only displayed in a different way. The Stacked 100% Series display doesn’t represent the actual values but rather the relative value of each element of the Series to a total of 100%.
| Width1Width3Width1418Width3Width4749Width3Width1559
Fig. a A 3D Bar Series showing four methods to display the same information. |
 |
Stacked property
NoneWidth1Width3Width1418Width3Width4749Width3Width1559 |
| Fig. b | 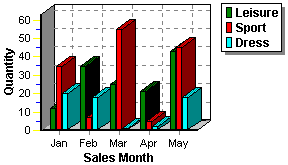 |
SideWidth1Width3Width1418Width3Width4749Width3Width1559 |
| Fig. c | 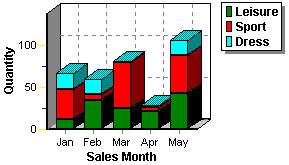 |
StackedWidth1Width3Width1418Width3Width4749Width3Width1559 |
| Fig. d | 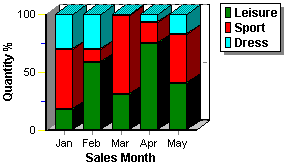 |
Stacked 100%Width1Width3Width1418Width3Width4749Width3Width1559 |