ASP.NET & TeeChart MVC. Supports NET (Core 2,3 & NET5+)
TeeChart for .NET can render as an image format such as PNG or JPEG or as a javascript HTML5 Canvas object, fully dynamic on the page.
These charts are created using an ActionResult but there are many ways to extract the rendered chart to the page.
We're calling the script from the page in this way:
/TeeChartMVC/GetHTML5Chart?type=2
The TeeChart MVC Controller created for this example derives from System.Web.Mvc.Controller. The functionality is available with all TeeChart for .NET products.
basic required code:
    public ActionResult GetHTML5Chart(int? number)
    {
      lock (renderLock)
      {
        Steema.TeeChart.TChart wChart3 = new Steema.TeeChart.TChart();

        if (number==0) //react to input variables
          wChart3.Series.Add(new Steema.TeeChart.Styles.Pie());
        else
          wChart3.Series.Add(new Steema.TeeChart.Styles.Line());

        wChart3.Series[0].FillSampleValues(); //data fill routines

        //optional - add in some custom javascript
        string[] customCode = new string[] {" chart1.applyTheme(\"minimal\");" };
        wChart3.Export.Image.JScript.CustomCode = customCode;

        tempStream2 = new System.IO.MemoryStream(); //create stream for transport
        wChart3.Export.Image.JScript.Width = 800; //size the Chart
        wChart3.Export.Image.JScript.Height = 300;
        wChart3.Export.Image.JScript.Save(tempStream2); //write to stream

        tempStream2.Position = 0;
        System.IO.StreamReader sr = new System.IO.StreamReader(tempStream2);

        return Content(sr.ReadToEnd()); //return the Chart to the caller
      }
    }
Custom Javascript enhancements
TeeChart will generate a Chart without requiring any javascript coding by you. The Chart is generated in .NET and the Javascript code with HTML5 Canvas is rendered for the output.
Optionally you can add enhancements to be actioned at any moment clientside in response to factors unavailable at Chart creation time. In the above chart we have added just one extra line to set a visualisation colour theme.
HTML5 Chart with animation
The chart below is running a repeat animation cycle (cycled so that we can see what it's doing). We've added some custome code into the javascript expoort of the Chart.
The code is added inline to the Chart code before render. The source-link path to the additional .js file that supports the feature, teechart-animations.js, is added as an additional source link. The way the source link is called here is currently supported when using the WebChart component only, but the functionality has now been added for the September release to fully support MVC widgets.
wChart3.Export.Image.JScript.SourceUnits.Add("teechart-animations.js");
List customCode = new List();
....
wChart3.Series.Add(new Steema.TeeChart.Styles.Bar());

List extFunc = new List();

extFunc.Add("var animation;");
extFunc.Add("var loopCounter = 0;");

extFunc.Add("function manualLoop()");
extFunc.Add("{");
extFunc.Add("animation.animate(" + wChart3.Export.Image.JScript.ChartName +");");
extFunc.Add("loopCounter++;");
extFunc.Add("if (loopCounter < 10)");
extFunc.Add("  setTimeout(manualLoop, 9000);");
extFunc.Add("}");

wChart3.Export.Image.JScript.ExternalCode = extFunc.ToArray();

wChart3.Export.Image.JScript.SourceUnits.Add("teechart-animations.js");

customCode.Add("   //animation");
customCode.Add("   animation = new Tee.SeriesAnimation();");
customCode.Add("   animation.duration = 3900;");
customCode.Add("   animation.kind = \"each\";");
customCode.Add("   fadeAnimation = new Tee.FadeAnimation();");
customCode.Add("   fadeAnimation.duration = 5000;");
customCode.Add("   fadeAnimation.fade.series = true;");
customCode.Add("   fadeAnimation.fade.marks = true;");
customCode.Add("   animation.mode = \"linear\"; ");
customCode.Add("   fadeAnimation.mode = \"linear\";");
customCode.Add("   animation.items.push(fadeAnimation);");
customCode.Add("   ");
customCode.Add("   animation.animate(chart1);");

customCode.Add("  setTimeout(manualLoop, 6000); ");
....
mvcChart3.Export.Image.JScript.CustomCode = customCode.ToArray();
Interpolation Example
This chart takes in some of the content from the previous
examples and adds one further layer to aid analysis, interpolating
Series values between points.
The code is added serverside in the Controller when creating
the Chart in .NET or, alternatively you can add the code to the View as
staright Javascript code.
The result will look like the following. TeeChart is using:
- A ToolTip
- A CursorTool
- An OnChange event to modify external content
Html.RenderAction
The previous charts in this page all respond as ActionResults and have been called as iframes in the page. This has some use as the frames can be plucked and rendered standalone. The following chart is fully inline. It is called via the Html.RenderAction method and embeds the output to the current page.
ie. @{ Html.RenderAction("CreateInlineChart", "TeeChartMVC", new { flag = 2, width = 970, height = 400 }); }
public ActionResult CreateInlineChart(int flag, int width, int height)
{
    System.IO.MemoryStream ms = new System.IO.MemoryStream();

    StringBuilder builder = new StringBuilder();

    Steema.TeeChart.TChart wChart3 = new Steema.TeeChart.TChart();
    Steema.TeeChart.Styles.Bubble bubble = new Steema.TeeChart.Styles.Bubble();
    wChart3.Series.Add(bubble);
    wChart3.Legend.Visible = false;
    wChart3.Header.Visible = false;
    bubble.FillSampleValues(50);

    Steema.TeeChart.Export.JavascriptFormat format = (Steema.TeeChart.Export.JavascriptFormat)(wChart3.Export.Image.JScript);

    format.DoFullPage = false; //embedding code without headers

    //name the related page elements
    string ClientID = "w3";
    format.CanvasName = ClientID + "img";
    format.ChartName = ClientID + "_chart";

    format.Width = width;
    format.Height = height;

    string[] customCodeS = new string[] {
    //page code of choice ....
    };

    format.CustomCode = customCodeS.ToArray();

    System.IO.MemoryStream chartImg = new System.IO.MemoryStream();

    format.Save(chartImg);

    chartImg.Position = 0;
    var sr = new System.IO.StreamReader(chartImg);
    var javaScr = sr.ReadToEnd();

    //add the source paths
    builder.AppendLine("
    <script src="https://www.steema.com/files/public/teechart/html5/latest/src/teechart.js" type="text/javascript"></script>");
    builder.AppendLine("
    <script src="https://www.steema.com/files/public/teechart/html5/latest/src/teechart-extras.js" type="text/javascript"></script>");

    //add our code block and load caller
    builder.AppendLine("
    <script language="Javascript" type="text/javascript">
        ");
            builder.AppendLine(" window.onload = function(){ draww3() };");
            builder.AppendLine("var " + format.ChartName + ";\r\nfunction draw" + ClientID.ToString() + "() {\r\n");

            //add-in chart code
            builder.AppendLine(javaScr);

            builder.AppendLine("}\r\n");
            builder.AppendLine("</script>\r\n");

    string styleStr = ""; //optional

    //add the HTML5 canvas
    builder.AppendLine("<canvas id="" + ClientID.ToString() + "img" " + " Name="" + ClientID.ToString() + "img" " + (styleStr.Length > 0 ? (styleStr + " " ") : " style=""")
                                + " width=" " + format.Width + " " height="" + format.Height + "">
        ");

        builder.AppendLine("\r\nThis browser does not seem to support HTML5 Canvas.");
        builder.AppendLine("\r\n
    </canvas>\r\n");

    return Content(builder.ToString());
}
Enhanced Static image formats
TeeChart supports static formats too in MVC. This is useful when delivering some complex chart formats that are not yet fully supported in Javascript. We can however, bring static images to life too with Ajax enhancements originally implemented for TeeChart's ASP.NET Webform Chart. The example below simply builds an image map to create mouseover hotpsots. For this example the hints return some value-add information about overall percentages but with access to this methodology you could go a lot further to offer inline or click-back drill down on Series values.
For example, this Bar Chart with hotspot Marks:
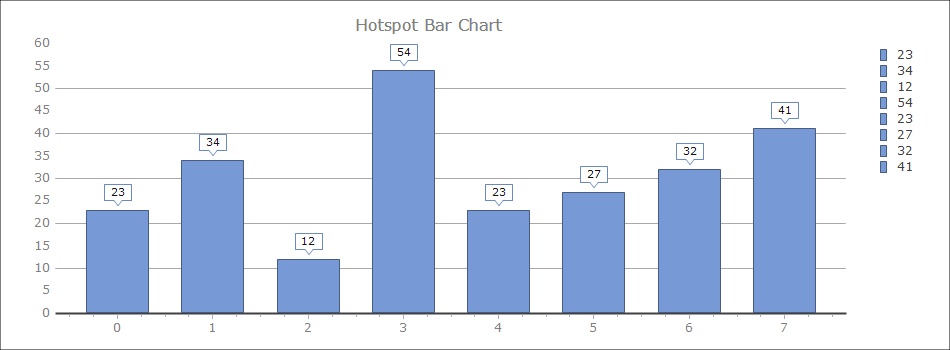
                Calling the map in this way:

                <img usemap="#MAPWebChart1" id="Chartimg3" src="/TeeChartMVC/TeeChartMVC/GetStaticBarChart?w=950&h=350&image=true"
                    style="border:none;  width:970px; height:350px" >
                @{ Html.RenderAction("GetStaticBarChart", "TeeChartMVC", new { w = 950, h = 350, image = false }); }
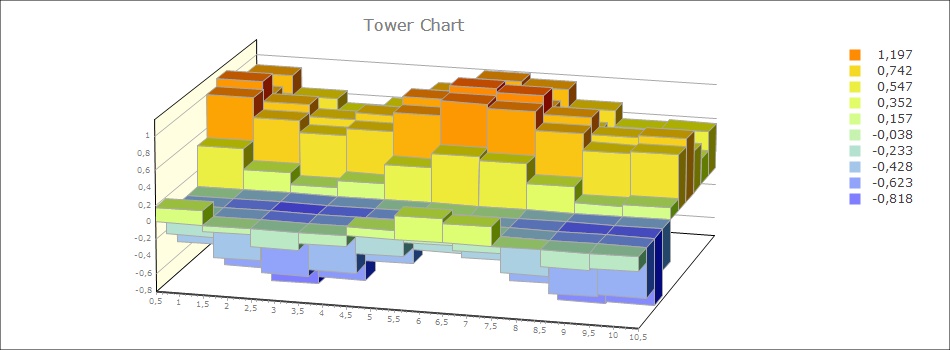
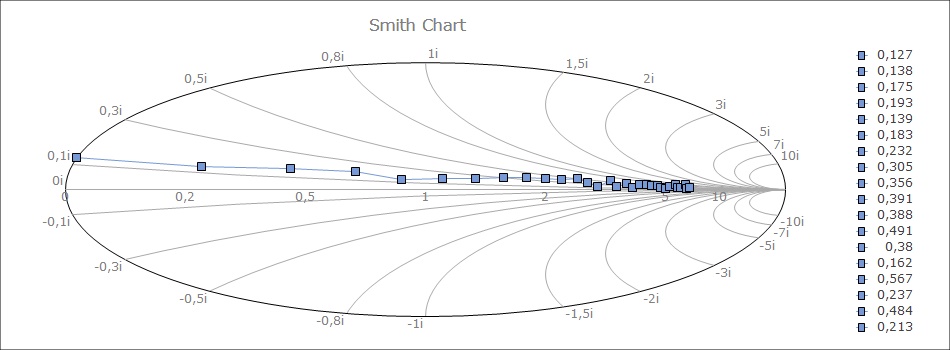
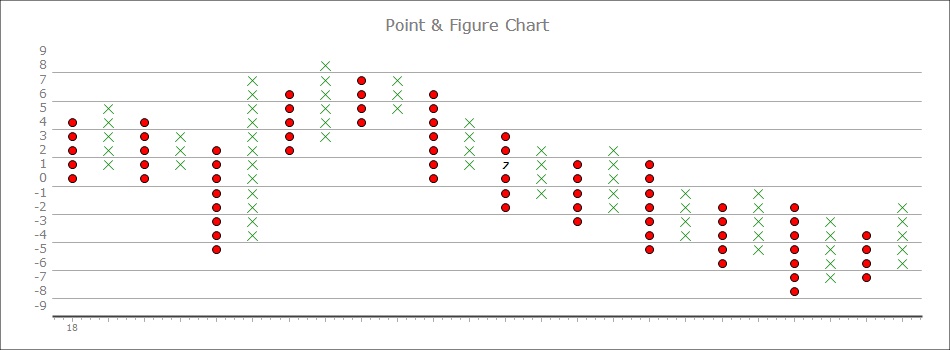
Static image formats
You may wish to render charts as a static image. All TeeChart's Series/Chart types may be rendered this way.
For example, this Tower Chart:
or this Smith Chart:
or this Point & Figure Chart:
Other formats and Options
Left us know if you're interested in doing something else and these demos haven't made the possibility clear to you and we'll be happy to take a look and get back to you.