Page 1 of 1
Legends and Tooltips
Posted: Fri Jun 13, 2014 9:20 am
by 17069345
Thank you for your answer

Now I have a question about Legends and Tooltips:
I want to
limit the number of Legend Entries - but
these Entries, which were affected by limitation should be viewable through an "Legend-Tab". That means there should be a symbol right of the entries, I can tab on it, and then I should see the remaining Legend Entries.
An Example:
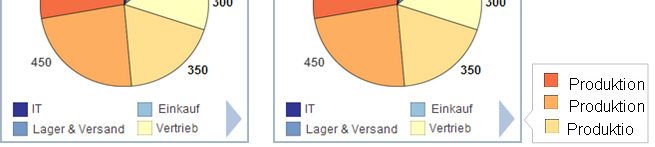
- LegendTabEvent.png (19.72 KiB) Viewed 10970 times
Thank you Yeray.
Re: Legends and Tooltips
Posted: Fri Jun 13, 2014 10:01 am
by yeray
Hello,
I've split this question into a new thread because it looks as a totally different one.
This comes from
this thread
Please read the instructions in my signature for the benefit of all the community.
We'll give you an answer to the technical question asap.
Re: Legends and Tooltips
Posted: Fri Jun 13, 2014 2:02 pm
by yeray
Hello again,
You could hide the main legend and then use 2 dummy series (hidden and with a subset of the point in the main series). Then you could use 2 ExtraLegend tools and show these legends. Here you have a simple example:
Code: Select all
		Pie pie1 = new Pie(tChart1.getChart());
		pie1.fillSampleValues();
		pie1.setCircled(true);
		tChart1.getLegend().setVisible(false);

		Pie dummy1 = new Pie(tChart1.getChart());
		Pie dummy2 = new Pie(tChart1.getChart());
		dummy1.setVisible(false);
		dummy2.setVisible(false);

		for (int i=0; i<pie1.getCount(); i++) {
			if (i<4)
				dummy1.add(i, pie1.getYValues().getValue(i), pie1.getLabels().getString(i), pie1.getValueColor(i));
			else
				dummy2.add(i, pie1.getYValues().getValue(i), pie1.getLabels().getString(i), pie1.getValueColor(i));
		}

		extraleg1 = new ExtraLegend(tChart1.getChart());
		extraleg1.setSeries(dummy1);
		extraleg1.getLegend().setAlignment(LegendAlignment.BOTTOM);
		extraleg1.getLegend().setCustomPosition(true);
		extraleg1.getLegend().setLeft(60);
		extraleg1.getLegend().setTop(600);

		extraleg2 = new ExtraLegend(tChart1.getChart());
		extraleg2.setSeries(dummy2);
		extraleg2.getLegend().setCustomPosition(true);
		extraleg2.getLegend().setLeft(310);
		extraleg2.getLegend().setTop(545);
		extraleg2.getLegend().setVisible(false);

		tChart1.addChartMouseListener(new ChartMouseAdapter() {

			@Override
			public void backgroundClicked(ChartMouseEvent e) {
				if (extraleg1.getLegend().clicked(e.getPoint()) > -1) {
					extraleg2.getLegend().setVisible(!extraleg2.getLegend().getVisible());
				}
			}
		});
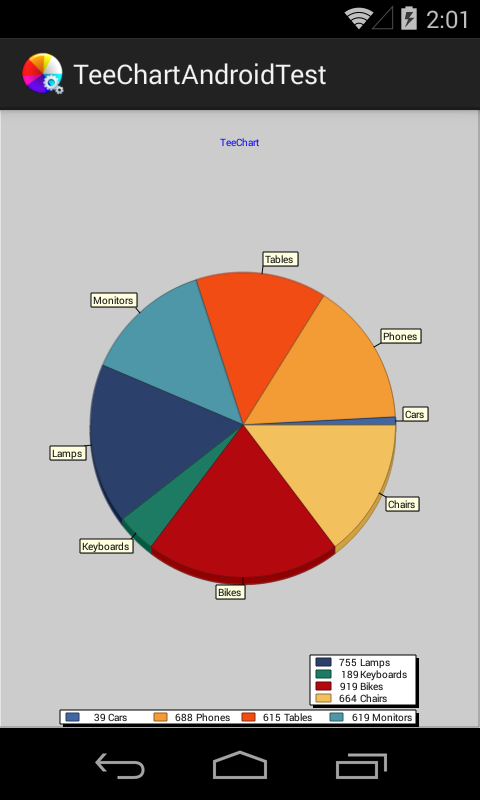
- device-2014-06-13-160147.png (45.72 KiB) Viewed 10946 times