Page 1 of 1
Financial indicators in Javascript / HTML5
Posted: Thu Jan 07, 2016 8:55 am
by 15676988
Hi,
Does teechart support financial indicators in Javascript / HTML5? I couldn't find any about this. If it's possible where I can find example to integrate it?
Re: Financial indicators in Javascript / HTML5
Posted: Thu Jan 07, 2016 11:25 am
by yeray
Hello,
I'm afraid TeeChart Javascript/HTML5 doesn't include functions like the other versions.
However, you can always do the calculations from your main series and add the according points to an extra series manually.
Don't hesitate to let us know if you find any problem with that.
Re: Financial indicators in Javascript / HTML5
Posted: Fri Jan 08, 2016 1:36 pm
by 15676988
Thanks for your answer. May you apply an example how to integrate some of these Trend line, Bollinger, MACD?
Re: Financial indicators in Javascript / HTML5
Posted: Mon Jan 11, 2016 12:00 pm
by yeray
Hello,
A simple example would be this kind of mean function:
Code: Select all
var Chart1;

function draw() {
  Chart1=new Tee.Chart("canvas1");

  candle1 = new Tee.Candle();
  Chart1.addSeries(candle1);
  candle1.addRandom(20);

  msecsInADay=86400000; //24*60*60*1000
  candle1.data.x=new Array(candle1.count());
  var now=new Date(), tmp;
  for (t=0; t<candle1.count(); t++) {
	  tmp=new Date(now.getTime() + t * msecsInADay);
	  candle1.data.x[t] = tmp;
  }

  Chart1.legend.visible = false;

  myLineFunc1 = new MyLineFunc();
  Chart1.addSeries(myLineFunc1);
  myLineFunc1.data.source = candle1;
  myLineFunc1.fillFromDataSource();

  Chart1.draw();
}

MyLineFunc=function(o,o2) {
    Tee.Line.call(this,o,o2);

    this.fillFromDataSource=function() {
        if (this.data.source instanceof Tee.Series) {
            s = this.data.source;
            sum = s.data.close.reduce((a, b) => a + b, 0);  //sum of close values in the candle
            mean = sum / s.count();
            this.data.values = [mean, mean];
            this.data.x = [s.data.x[0], s.data.x[s.count()-1]];
        }
    }
}

MyLineFunc.prototype=new Tee.Line();
Re: Financial indicators in Javascript / HTML5
Posted: Thu Jan 14, 2016 9:53 am
by 15676988
It will help us thanks a lot!
Re: Financial indicators in Javascript / HTML5
Posted: Tue Mar 01, 2016 4:08 pm
by 15676988
Hi again,
we need from your help about the Bollinger Bands indicator
The bands are calculating from all data as is below:
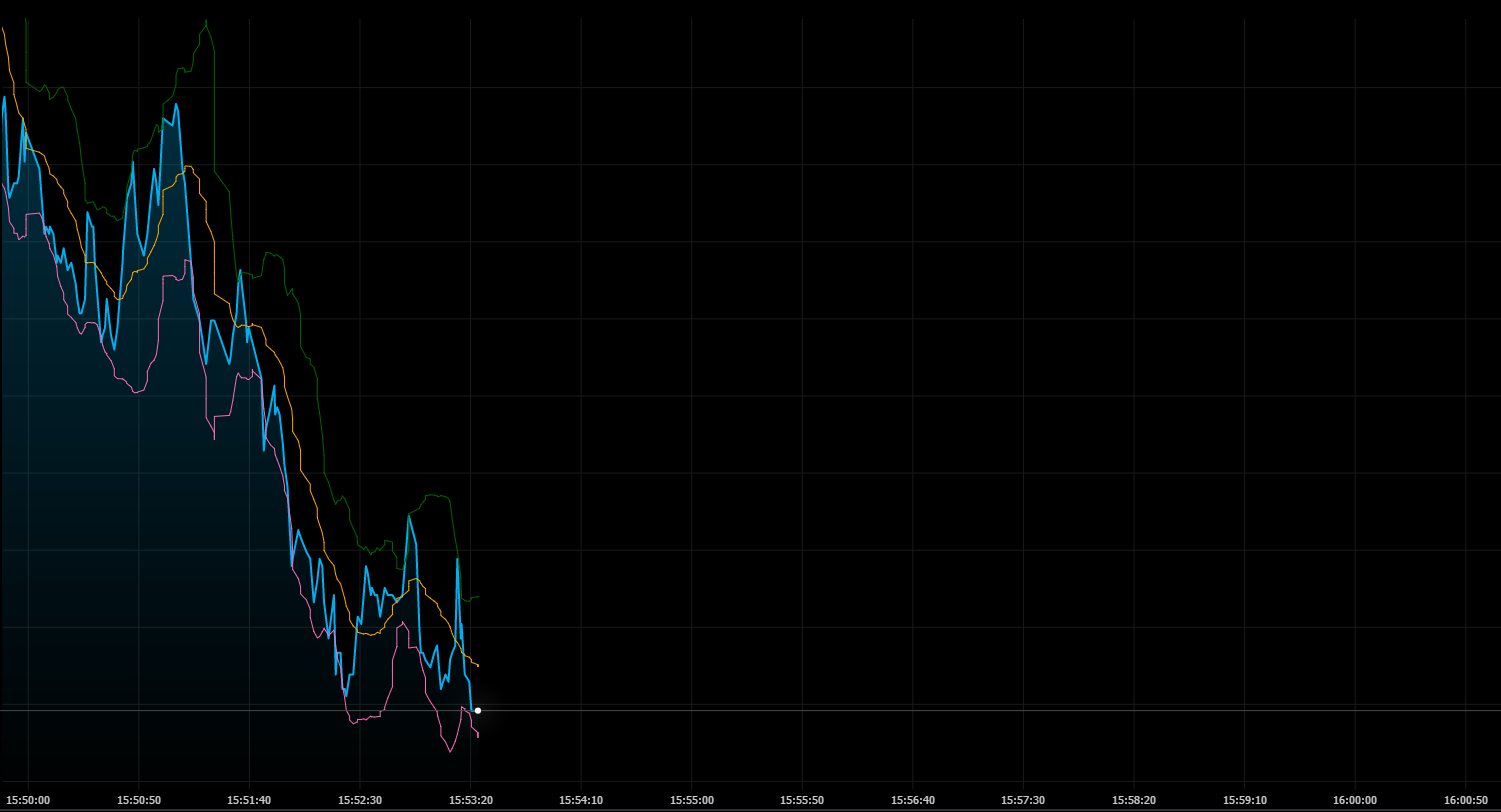
- BBAllData.png (83.86 KiB) Viewed 17989 times
but the lines are very curved now. We want to make lines more smooth and straight.
When try to use only one fifth part of all data we lost the lines as is below:
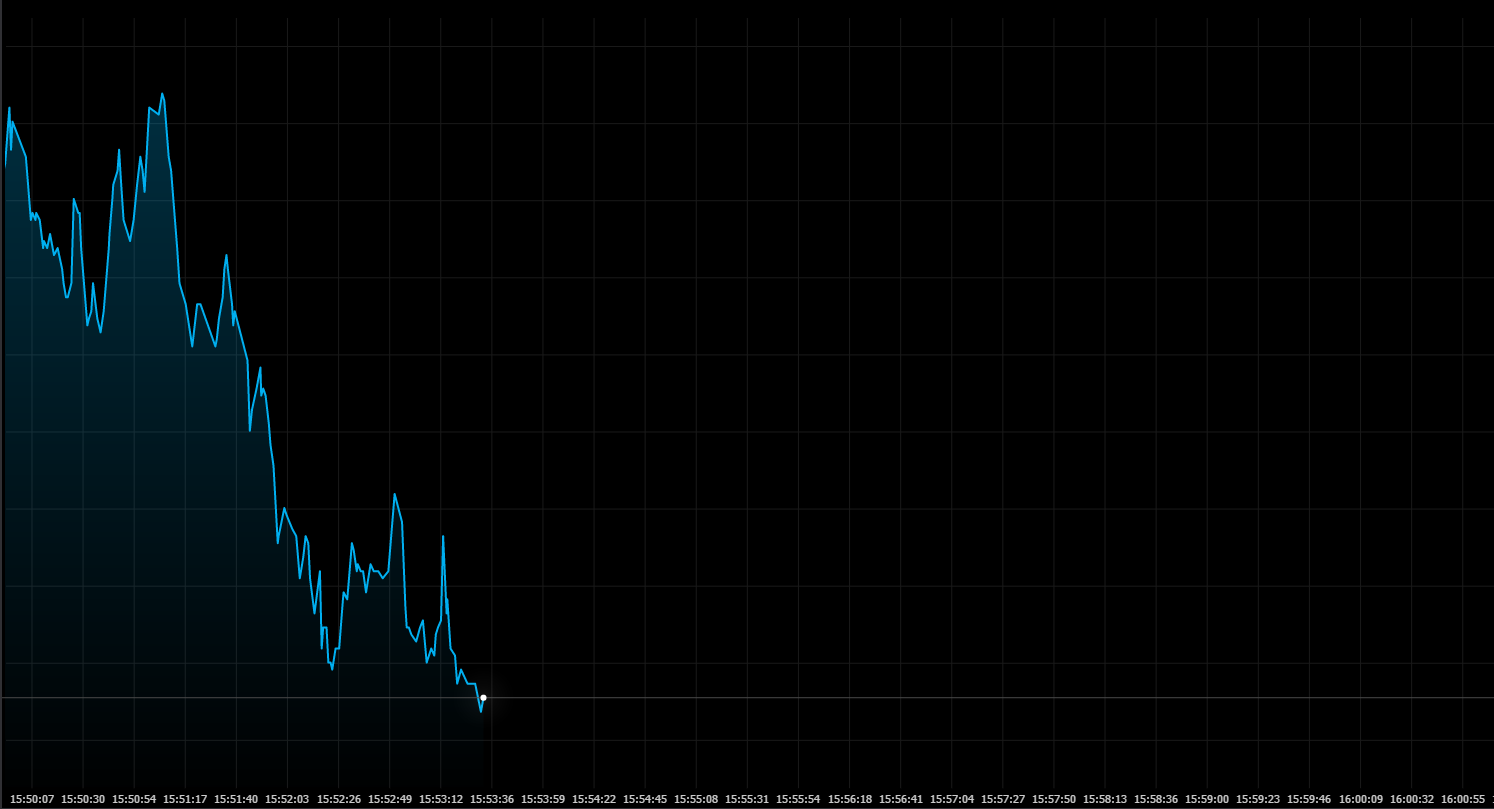
- BB1.5Data.png (65.08 KiB) Viewed 17996 times
Please advice how can achieve it.
Re: Financial indicators in Javascript / HTML5
Posted: Wed Mar 02, 2016 9:04 am
by yeray
Hello,
It's difficult to guess what are you exactly doing. Could you please arrange a simple example we can run as-is to reproduce the situation here? (note our
Bug Fixing Policy).
Re: Financial indicators in Javascript / HTML5
Posted: Fri Mar 11, 2016 1:24 pm
by 15676988
When were start to prepare a simple example in the meantime we found the mistake.
Sorry for the unnecessary post.
Re: Financial indicators in Javascript / HTML5
Posted: Fri Mar 11, 2016 2:53 pm
by yeray
Hello,
I'm glad to hear it!