Stacked Bar Chart and Legend

TeeChart VCL for Borland/CodeGear/Embarcadero RAD Studio, Delphi and C++ Builder.
Errol
Newbie
Newbie
Posts: 75
Joined: Thu Jul 11, 2013 12:00 am

Stacked Bar Chart and Legend

Post by Errol » Wed Mar 05, 2014 10:24 am

Hi Yeray

Thanks for your help to date. Now I have a really tricky question. I have created two series, one representing the rock types down a well, and the other an list of unique rock types, sorted alphabetically. Using these, I can display two stacked bar charts (see attachment). I would like to show the first stacked bar chart but display the legend appropriate to the other. I can hide one of the charts easily enough by setting the Y-axis value to 0 for all data points. I have the colors correct for the 2nd series (by using a Legend.Symbol.OnDraw event) but cannot change the text (GetLegendText seems to always gets the text for the first series) and I cannot suppress the extra legend symbols. Ideas welcome.

Best regards

Errol
Series1_and_Legend2.png
Series1_and_Legend2.png (26.17 KiB) Viewed 16497 times

Yeray
Site Admin
Site Admin
Posts: 9533
Joined: Tue Dec 05, 2006 12:00 am
Location: Girona, Catalonia
Contact:

Re: Stacked Bar Chart and Legend

Post by Yeray » Wed Mar 05, 2014 3:38 pm

Hi Errol,
Errol wrote:Thanks for your help to date. Now I have a really tricky question. I have created two series, one representing the rock types down a well, and the other an list of unique rock types, sorted alphabetically. Using these, I can display two stacked bar charts (see attachment). I would like to show the first stacked bar chart but display the legend appropriate to the other. I can hide one of the charts easily enough by setting the Y-axis value to 0 for all data points. I have the colors correct for the 2nd series (by using a Legend.Symbol.OnDraw event) but cannot change the text (GetLegendText seems to always gets the text for the first series) and I cannot suppress the extra legend symbols. Ideas welcome.
In general, if you have two series in a chart and you only want one of them to be shown in the legend, you can hide a series with ShowInLegend:=false
However, I'm not sure to understand what's the exact configuration of your chart.
Here is the minimum code to create a chart with two TBarSeries SelfStacked, similar to what I understand you are doing:

Code: Select all

uses Series;

procedure TForm1.FormCreate(Sender: TObject);
var i, j: Integer;
    tmpColor: TColor;
begin
  Chart1.View3D:=false;

  for i:=0 to 1 do
  with Chart1.AddSeries(TBarSeries) as TBarSeries do
  begin
    MultiBar:=mbSelfStack;
    MarksOnBar:=true;
    MarksLocation:=mlCenter;
    ColorEachPoint:=true;

    for j:=0 to 4 do
    begin
      if (i=0) then
        tmpColor:=OperaPalette[j]
      else
        tmpColor:=MetroPalette[j];

      Add(25+random*75, 'S' + inttoStr(i) + ' L' + IntToStr(j), tmpColor);
    end;
  end;

  Chart1.Legend.Alignment:=laBottom;
  Chart1.Axes.Bottom.LabelStyle:=talValue;
end;
However, I don't get a legend like yours. With the default LegendStyle (lsAuto), I get two items in the legend, one per series:
2014-03-05_1631.png
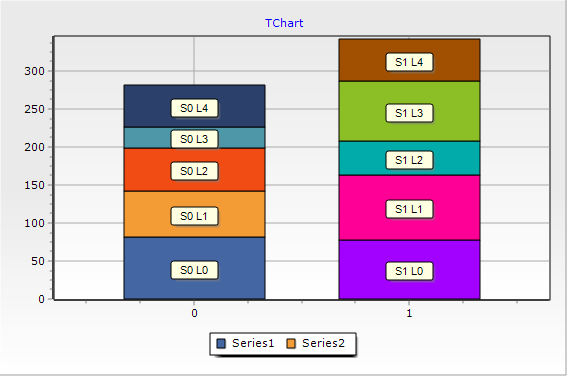
2014-03-05_1631.png (15.55 KiB) Viewed 16416 times
And if I add this to the code above to force the values to be shown in the legend:

Code: Select all

  Chart1.Legend.LegendStyle:=lsValues;
Then I get only the values of the first series in the legend:
2014-03-05_1631_001.png
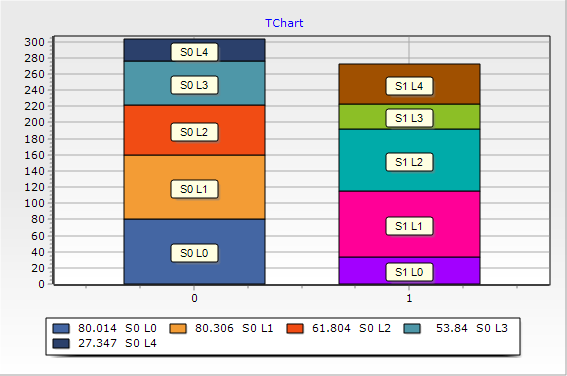
2014-03-05_1631_001.png (19.47 KiB) Viewed 16404 times
It would be helpful if you could take the code above and modify the minimum so it can reproduce the situation you are trying to handle here.

As an advance, I can tell you that some customers with problems setting their legends prefer to remove all the series they have from the legend (with ShowInLegend:=false) and then they add as many dummy series (series with no values) as entries they want in the legend. These dummy series are the ones that will be shown in the legend so you may want to change their color, pattern or title.
Best Regards,
ImageYeray Alonso
Development & Support
Steema Software
Av. Montilivi 33, 17003 Girona, Catalonia (SP)
Image Image Image Image Image Image Please read our Bug Fixing Policy

Errol
Newbie
Newbie
Posts: 75
Joined: Thu Jul 11, 2013 12:00 am

Re: Stacked Bar Chart and Legend

Post by Errol » Thu Mar 06, 2014 5:21 am

Hi Yeray

Thanks for your suggestions. The ShowInLegend command did the trick. I simply overlooked this and was using Legend.Visible instead. However, I still have one problem. I would like to left-justify the legend text. I have tried Legend.TextAlignment := taLeftJustified but no joy. How do I left justify the legend text?

Regards

Errol

Yeray
Site Admin
Site Admin
Posts: 9533
Joined: Tue Dec 05, 2006 12:00 am
Location: Girona, Catalonia
Contact:

Re: Stacked Bar Chart and Legend

Post by Yeray » Thu Mar 06, 2014 8:47 am

Hi Errol,
Errol wrote:Thanks for your suggestions. The ShowInLegend command did the trick. I simply overlooked this and was using Legend.Visible instead.
Glad to be helpful.
Errol wrote: However, I still have one problem. I would like to left-justify the legend text. I have tried Legend.TextAlignment := taLeftJustified but no joy. How do I left justify the legend text?
What do you mean with "left justify"? How does your legend look at the moment and how would you like it to look?
Best Regards,
ImageYeray Alonso
Development & Support
Steema Software
Av. Montilivi 33, 17003 Girona, Catalonia (SP)
Image Image Image Image Image Image Please read our Bug Fixing Policy

Errol
Newbie
Newbie
Posts: 75
Joined: Thu Jul 11, 2013 12:00 am

Re: Stacked Bar Chart and Legend

Post by Errol » Fri Mar 07, 2014 6:06 am

Hi Yeray

Sorry I meant to attach a diagram but forgot, so here it is. I would like to write the text immediately following the legend symbol, rather than having it justified to the right side of the legend text space as at present.

Best regards

Errol
BarChart_Legend.png
BarChart_Legend.png (20.81 KiB) Viewed 16392 times

Yeray
Site Admin
Site Admin
Posts: 9533
Joined: Tue Dec 05, 2006 12:00 am
Location: Girona, Catalonia
Contact:

Re: Stacked Bar Chart and Legend

Post by Yeray » Fri Mar 07, 2014 3:53 pm

Hello Errol,
Errol wrote:I would like to write the text immediately following the legend symbol, rather than having it justified to the right side of the legend text space as at present.
I understand what you see and what you want to obtain, but I can't reproduce the situation you have.
I'm trying to reproduce it with the code I posted above, here, adding these two lines of code at the end of the FormCreate method:

Code: Select all

  Chart1[0].Title:='This series has a long title';
  Chart1[1].Title:='Short';
And the legend I get shows the legend text left justified:
2014-03-07_1652.png
2014-03-07_1652.png (18.27 KiB) Viewed 16348 times
Please, as I said above,
Yeray wrote:It would be helpful if you could take the code above and modify the minimum so it can reproduce the situation you are trying to handle here.
Best Regards,
ImageYeray Alonso
Development & Support
Steema Software
Av. Montilivi 33, 17003 Girona, Catalonia (SP)
Image Image Image Image Image Image Please read our Bug Fixing Policy

Errol
Newbie
Newbie
Posts: 75
Joined: Thu Jul 11, 2013 12:00 am

Re: Stacked Bar Chart and Legend

Post by Errol » Mon Mar 10, 2014 2:51 am

Good morning Yeray

Here is the modified code that exhibits the offset legend. I have put the data record by record into two memory tables to be able to use the DataSource, LabelsSource and similar commands.

Best regards

Errol

Code: Select all

unit Legend_Test;

interface

uses
  Windows, Messages, SysUtils, Variants, Classes, Graphics, Controls, Forms,
  Dialogs, TeeGDIPlus, ExtCtrls, TeeProcs, TeEngine, Chart, series, DBChart,
  kbmMemTable,db;

type
  TForm1 = class(TForm)
    Chart1: TDBChart;
    procedure FormCreate(Sender: TObject);
    procedure GetAxisLabel(Sender: TChartAxis; Series: TChartSeries;
      ValueIndex: Integer; var LabelText: string);
    procedure GetLegendText(Sender: TCustomAxisPanel; LegendStyle: TLegendStyle;
      Index: Integer; var LegendText: string);
  private
    { Private declarations }
  public
    { Public declarations }
  end;

var
  Form1: TForm1;

implementation

{$R *.dfm}

procedure TForm1.FormCreate(Sender: TObject);
var i, j: Integer;
    tmpColor: TColor;
    s: string;
    DataSrc,LegendSrc: TkbmMemTable;


begin
  Chart1.View3D:=false;
  Chart1.Legend.LegendStyle:=lsValues;
  DataSrc := TkbmMemTable.Create(owner);

  DataSrc.FieldDefs.Add('Rock Type Code',ftString,10,false);
  DataSrc.FieldDefs.Add('Rock Type',ftString,32,false);
  DataSrc.FieldDefs.Add('Depth',ftFloat,0,false);
  DataSrc.FieldDefs.Add('Color',ftInteger,0,false);
  DataSrc.Open;

  DataSrc.Append;
  DataSrc.FieldByName('Rock Type Code').AsString := 'AND';
  DataSrc.FieldByName('Rock Type').AsString := 'Andesite';
  DataSrc.FieldByName('Depth').AsFloat := 100;
  DataSrc.FieldByName('Color').AsInteger := integer(TColor(clBlue));
  DataSrc.Post;

  DataSrc.Append;
  DataSrc.FieldByName('Rock Type Code').AsString := 'BRC';
  DataSrc.FieldByName('Rock Type').AsString := 'Brecciated Conglomerate';
  DataSrc.FieldByName('Depth').AsFloat := 50;
  DataSrc.FieldByName('Color').AsInteger := integer(TColor(clGreen));
  DataSrc.Post;

  DataSrc.Append;
  DataSrc.FieldByName('Rock Type Code').AsString := 'TUF';
  DataSrc.FieldByName('Rock Type').AsString := 'Tuff';
  DataSrc.FieldByName('Depth').AsFloat := 150;
  DataSrc.FieldByName('Color').AsInteger := integer(TColor(clYellow));
  DataSrc.Post;

  DataSrc.Append;
  DataSrc.FieldByName('Rock Type Code').AsString := 'AND';
  DataSrc.FieldByName('Rock Type').AsString := 'Andesite';
  DataSrc.FieldByName('Depth').AsFloat := 30;
  DataSrc.FieldByName('Color').AsInteger := integer(TColor(clBlue));
  DataSrc.Post;

  DataSrc.Append;
  DataSrc.FieldByName('Rock Type Code').AsString := 'BAS';
  DataSrc.FieldByName('Rock Type').AsString := 'Basalt Lava';
  DataSrc.FieldByName('Depth').AsFloat := 200;
  DataSrc.FieldByName('Color').AsInteger := integer(TColor(clRed));
  DataSrc.Post;

  LegendSrc := TkbmMemTable.Create(owner);

  LegendSrc.FieldDefs.Add('Rock Type Code',ftString,10,false);
  LegendSrc.FieldDefs.Add('Rock Type',ftString,32,false);
  LegendSrc.FieldDefs.Add('Depth',ftFloat,0,false);
  LegendSrc.FieldDefs.Add('Color',ftInteger,0,false);
  LegendSrc.Open;

  LegendSrc.Append;
  LegendSrc.FieldByName('Rock Type Code').AsString := 'AND';
  LegendSrc.FieldByName('Rock Type').AsString := 'Andesite';
  LegendSrc.FieldByName('Depth').AsFloat := 0;
  LegendSrc.FieldByName('Color').AsInteger := integer(TColor(clBlue));
  LegendSrc.Post;

  LegendSrc.Append;
  LegendSrc.FieldByName('Rock Type Code').AsString := 'BAS';
  LegendSrc.FieldByName('Rock Type').AsString := 'Basalt Lava';
  LegendSrc.FieldByName('Depth').AsFloat := 0;
  LegendSrc.FieldByName('Color').AsInteger := integer(TColor(clRed));
  LegendSrc.Post;

  LegendSrc.Append;
  LegendSrc.FieldByName('Rock Type Code').AsString := 'BRC';
  LegendSrc.FieldByName('Rock Type').AsString := 'Brecciated Conglomerate';
  LegendSrc.FieldByName('Depth').AsFloat := 0;
  LegendSrc.FieldByName('Color').AsInteger := integer(TColor(clGreen));
  LegendSrc.Post;

  LegendSrc.Append;
  LegendSrc.FieldByName('Rock Type Code').AsString := 'TUF';
  LegendSrc.FieldByName('Rock Type').AsString := 'Tuff';
  LegendSrc.FieldByName('Depth').AsFloat := 0;
  LegendSrc.FieldByName('Color').AsInteger := integer(TColor(clYellow));
  LegendSrc.Post;

  with Chart1.AddSeries(TBarSeries) as TBarSeries do
  begin
    MultiBar:=mbSelfStack;
    Marks.Visible := true;
    MarksOnBar:=true;
    MarksLocation:=mlCenter;
    ColorEachPoint:=true;
    ColorSource := 'Color';
    DataSource := DataSrc;
    XLabelsSource := 'Rock Type Code';
    YValues.ValueSource := 'Depth';
    ShowInLegend := false;
  end;

  with Chart1.AddSeries(TBarSeries) as TBarSeries do
  begin
    MultiBar:=mbSelfStack;
    Marks.Visible := false;
    ColorEachPoint:=true;
    ColorSource := 'Color';
    DataSource := LegendSrc;
    XLabelsSource := 'Rock Type';
    YValues.ValueSource := 'Depth';
    ShowInLegend := true;
  end;

  Chart1.Legend.Alignment:=laBottom;
  Chart1.OnGetAxisLabel:=GetAxisLabel;
end;

procedure TForm1.GetAxisLabel(Sender: TChartAxis; Series: TChartSeries;
  ValueIndex: Integer; var LabelText: string);
begin
  if (Sender = Chart1.Axes.Bottom) then
    LabelText:='';
end;

procedure TForm1.GetLegendText(Sender: TCustomAxisPanel;
  LegendStyle: TLegendStyle; Index: Integer; var LegendText: string);
var
  iPos: integer;
begin
  iPos := Pos(Chr(6),LegendText);
  if (iPos = 0) then
    LegendText := ' '
  else
    Delete(LegendText,1,iPos);
end;

end.

Yeray
Site Admin
Site Admin
Posts: 9533
Joined: Tue Dec 05, 2006 12:00 am
Location: Girona, Catalonia
Contact:

Re: Stacked Bar Chart and Legend

Post by Yeray » Tue Mar 11, 2014 11:46 am

Hi Errol,

I've simplified the code you posted to not to use tables and I could reproduce the problem you described above:

Code: Select all

uses Series;

procedure TForm1.FormCreate(Sender: TObject);
begin
  Chart1.View3D:=false;
  Chart1.Legend.LegendStyle:=lsValues;

  with Chart1.AddSeries(TBarSeries) as TBarSeries do
  begin
    MultiBar:=mbSelfStack;
    Marks.Visible := true;
    MarksOnBar:=true;
    MarksLocation:=mlCenter;
    ColorEachPoint:=true;

    Add(100, 'AND', clBlue);
    Add(50, 'BRC', clGreen);
    Add(150, 'TUF', clYellow);
    Add(30, 'AND', clBlue);
    Add(200, 'BAS', clRed);

    ShowInLegend := false;
  end;

  with Chart1.AddSeries(TBarSeries) as TBarSeries do
  begin
    MultiBar:=mbSelfStack;
    Marks.Visible := false;
    ColorEachPoint:=true;

    Add(0, 'Andesite', clBlue);
    Add(0, 'Basalt Lava', clRed);
    Add(0, 'Brecciated Conglomerate', clGreen);
    Add(0, 'Tuff', clYellow);
  end;

  Chart1.Legend.Alignment:=laBottom;
  Chart1.OnGetAxisLabel:=GetAxisLabel;
  Chart1.OnGetLegendText:=GetLegendText;
end;

procedure TForm1.GetAxisLabel(Sender: TChartAxis; Series: TChartSeries;
  ValueIndex: Integer; var LabelText: string);
begin
  if (Sender = Chart1.Axes.Bottom) then
    LabelText:='';
end;

procedure TForm1.GetLegendText(Sender: TCustomAxisPanel;
  LegendStyle: TLegendStyle; Index: Integer; var LegendText: string);
var
  iPos: integer;
begin
  iPos := Pos(Chr(6),LegendText);
  if (iPos = 0) then
    LegendText := ' '
  else
    Delete(LegendText,1,iPos);
end;
2014-03-11_1235.png
2014-03-11_1235.png (13.68 KiB) Viewed 16305 times
However, I see you are adding only one series for the legend, and adding values with labels to this series. Note this is not exactly what I suggested you above:
Yeray wrote:As an advance, I can tell you that some customers with problems setting their legends prefer to remove all the series they have from the legend (with ShowInLegend:=false) and then they add as many dummy series (series with no values) as entries they want in the legend. These dummy series are the ones that will be shown in the legend so you may want to change their color, pattern or title.
To clarify, my suggestion is to create one series per entry you want to have in the legend. Then, there'll be no need to use OnGetLegendText event.
Here you have an example:

Code: Select all

uses Series;

procedure TForm1.FormCreate(Sender: TObject);
begin
  Chart1.View3D:=false;
  Chart1.Legend.LegendStyle:=lsValues;

  with Chart1.AddSeries(TBarSeries) as TBarSeries do
  begin
    MultiBar:=mbSelfStack;
    Marks.Visible := true;
    MarksOnBar:=true;
    MarksLocation:=mlCenter;
    ColorEachPoint:=true;

    Add(100, 'AND', clBlue);
    Add(50, 'BRC', clGreen);
    Add(150, 'TUF', clYellow);
    Add(30, 'AND', clBlue);
    Add(200, 'BAS', clRed);

    ShowInLegend := false;
  end;

  with Chart1.AddSeries(TBarSeries) as TBarSeries do
  begin
    Title:='Andesite';
    Color:=clBlue;
  end;

  with Chart1.AddSeries(TBarSeries) as TBarSeries do
  begin
    Title:='Basalt Lava';
    Color:=clRed;
  end;

  with Chart1.AddSeries(TBarSeries) as TBarSeries do
  begin
    Title:='Brecciated Conglomerate';
    Color:=clGreen;
  end;

  with Chart1.AddSeries(TBarSeries) as TBarSeries do
  begin
    Title:='Tuff';
    Color:=clYellow;
  end;

  Chart1.Legend.Alignment:=laBottom;
  Chart1.Legend.LegendStyle:=lsSeries;
  Chart1.OnGetAxisLabel:=GetAxisLabel;
  //Chart1.OnGetLegendText:=GetLegendText;
end;

procedure TForm1.GetAxisLabel(Sender: TChartAxis; Series: TChartSeries;
  ValueIndex: Integer; var LabelText: string);
begin
  if (Sender = Chart1.Axes.Bottom) then
    LabelText:='';
end;
2014-03-11_1238.png
2014-03-11_1238.png (13.62 KiB) Viewed 16299 times
Best Regards,
ImageYeray Alonso
Development & Support
Steema Software
Av. Montilivi 33, 17003 Girona, Catalonia (SP)
Image Image Image Image Image Image Please read our Bug Fixing Policy

Errol
Newbie
Newbie
Posts: 75
Joined: Thu Jul 11, 2013 12:00 am

Re: Stacked Bar Chart and Legend

Post by Errol » Thu Mar 13, 2014 4:45 am

Hi Yeray

Thanks for your suggestions. However, creating a separate series for each legend item causes another problem. I use an OnDraw event to draw the pattern, foreground and background colors, as follows:

self.Owner.Chart.Legend.Symbol.OnDraw:=LegendDraw;

Unfortunately, the value of ValueIndex in the LegendDraw procedure is now always -1, so I am unable to select the correct data from the dataset to draw the legend symbol. The LegendDraw procedure appears to know the position of the symbol rectangle, but not its index in the legend.

I have tried rewriting the LegendDraw event as a regular procedure and calling it as each series is created, but I do not know how to find the legend symbol rectangle coordinates.

Suggestions appreciated.

Best regards

Errol

Errol
Newbie
Newbie
Posts: 75
Joined: Thu Jul 11, 2013 12:00 am

Re: Stacked Bar Chart and Legend

Post by Errol » Sat Mar 15, 2014 2:01 am

Good morning Yeray

Further to my previous post, I am still having problems with using the Chart1.Legend.Symbol.OnDraw event when the legend is derived from a number of series rather than a single series. In the multiple series case, the value of ValueIndex in the OnDraw event is always set to -1, and so cannot be used to determine which series data is applied to each legend symbol. I thought I could get round this by using a global index variable to count through the legend positions, but then found that the OnDraw event does not always start at the first legend position, so the legend symbols are drawn in the incorrect positions.

Is there an alternative method to determine which symbol position the OnDraw event is referring to, or do you plan to modify the code so that ValueIndex specifies this position?

I look forward to your comments.

Best regards

Errol

Yeray
Site Admin
Site Admin
Posts: 9533
Joined: Tue Dec 05, 2006 12:00 am
Location: Girona, Catalonia
Contact:

Re: Stacked Bar Chart and Legend

Post by Yeray » Mon Mar 17, 2014 8:54 am

Hi Errol,

You could try have your own index that is sequentially incremented at the Legend's Symbol OnDraw event and initialized each time the chart is being repainted, using come event that is being called before the OnDraw event, like OnGetLegendRect event. Ie:

Code: Select all

var DrawingIndex: Integer;

procedure TForm1.FormCreate(Sender: TObject);
begin
  //...
  Chart1.OnGetLegendRect:=GetLegendRect;
  Chart1.Legend.Symbol.OnDraw:=LegendSymbolDraw;
end;

//...

procedure TForm1.GetLegendRect(Sender:TCustomChart; var Rect:TRect);
begin
  DrawingIndex:=0;
end;

procedure TForm1.LegendSymbolDraw(Sender:TObject; Series:TChartSeries; ValueIndex:Integer; R:TRect);
begin
  with Chart1.Canvas do
  begin
    Brush.Style:=TBrushStyle(DrawingIndex+2);
    Rectangle(R);
  end;

  Inc(DrawingIndex);
end;
Best Regards,
ImageYeray Alonso
Development & Support
Steema Software
Av. Montilivi 33, 17003 Girona, Catalonia (SP)
Image Image Image Image Image Image Please read our Bug Fixing Policy

Errol
Newbie
Newbie
Posts: 75
Joined: Thu Jul 11, 2013 12:00 am

Re: Stacked Bar Chart and Legend

Post by Errol » Tue Mar 18, 2014 4:20 am

Good morning Yeray

Your suggested solution to the problem of the unknown position of the legend symbol worked - thank you. However, I have the following comments.
1. Rather than having to invoke an OnGetLegendText event, this problem would be better solved if the value of ValueIndex passed to a Legend.Symbol.OnDraw event reflected the position of the legend symbol, for both the single series and the multiple series cases. Would this be possible to implement in a future release?
2. The solution to the earlier problem of the legend text not left-justified when it is parsed and edited in an OnGetLegendText event was to use multiple series for the legend. However, this is not particularly satisfactory as I have a number of stacked bars on my chart and they now move around when I move between datasets with different numbers of legend items, as the total number of series changes. Do you plan to fix the post-parsing left-justification error in a new release?
3. These problems and solutions have raised another question which I will ask in a new thread.
Thanks and regards

Errol

Yeray
Site Admin
Site Admin
Posts: 9533
Joined: Tue Dec 05, 2006 12:00 am
Location: Girona, Catalonia
Contact:

Re: Stacked Bar Chart and Legend

Post by Yeray » Tue Mar 18, 2014 1:07 pm

Hello Errol,
Errol wrote:1. Rather than having to invoke an OnGetLegendText event, this problem would be better solved if the value of ValueIndex passed to a Legend.Symbol.OnDraw event reflected the position of the legend symbol, for both the single series and the multiple series cases. Would this be possible to implement in a future release?
I'm not sure if it will be possible but I've added it to the wish list:
http://bugs.teechart.net/show_bug.cgi?id=644
Also note it wouldn't be very coherent to have an argument called ValueIndex that gives a different thing (the series index) in some conditions (LegendStyle=lsSeries or LegendStyle=lsAuto and multiple series in the chart)
Errol wrote:2. The solution to the earlier problem of the legend text not left-justified when it is parsed and edited in an OnGetLegendText event was to use multiple series for the legend. However, this is not particularly satisfactory as I have a number of stacked bars on my chart and they now move around when I move between datasets with different numbers of legend items, as the total number of series changes. Do you plan to fix the post-parsing left-justification error in a new release?
I've added to the wish list the possibility to add some new property (ie MarksAlignment) to set the horizontal position of the marks in the legend. This property would complement the MarksLocation property:
http://bugs.teechart.net/show_bug.cgi?id=645
EDIT: Mistake here. This was a feature requested in a different thread.
Errol wrote:3. These problems and solutions have raised another question which I will ask in a new thread.
Thanks for understanding
Best Regards,
ImageYeray Alonso
Development & Support
Steema Software
Av. Montilivi 33, 17003 Girona, Catalonia (SP)
Image Image Image Image Image Image Please read our Bug Fixing Policy

Errol
Newbie
Newbie
Posts: 75
Joined: Thu Jul 11, 2013 12:00 am

Re: Stacked Bar Chart and Legend

Post by Errol » Tue Mar 18, 2014 11:44 pm

Good Morning Yeray

Thank you for your considered reply, and agreement to at forward these suggestions to your wish list. However, I am not sure that your argument against ValueIndex for a multiple-series legend is entirely justified.
Also note it wouldn't be very coherent to have an argument called ValueIndex that gives a different thing (the series index) in some conditions (LegendStyle=lsSeries or LegendStyle=lsAuto and multiple series in the chart)
With a single-series legend, ValueIndex represents both the series item index and the legend symbol index. For a multiple-series legend, ValueIndex is always set to -1 which is not very useful (or particularly coherent). To replace ValueIndex by SymbolIndex would give useful information in both cases.

For the second issue, I consider that the legend symbol text, after parsing and editing it, not being left-justified is an error. I note that TeeChart already has a property called Chart.Legend.TextAlignment which does not seem to do anything in this case. Surely it would be better to ensure this property does its job, rather than creating a new property, MarksAlignment that might get confused with general marks management ...

Best regards

Errol

Yeray
Site Admin
Site Admin
Posts: 9533
Joined: Tue Dec 05, 2006 12:00 am
Location: Girona, Catalonia
Contact:

Re: Stacked Bar Chart and Legend

Post by Yeray » Wed Mar 19, 2014 10:21 am

Hi Errol,
Errol wrote:Thank you for your considered reply, and agreement to at forward these suggestions to your wish list. However, I am not sure that your argument against ValueIndex for a multiple-series legend is entirely justified.
yeray wrote:Also note it wouldn't be very coherent to have an argument called ValueIndex that gives a different thing (the series index) in some conditions (LegendStyle=lsSeries or LegendStyle=lsAuto and multiple series in the chart)
With a single-series legend, ValueIndex represents both the series item index and the legend symbol index. For a multiple-series legend, ValueIndex is always set to -1 which is not very useful (or particularly coherent). To replace ValueIndex by SymbolIndex would give useful information in both cases.
I've added a comment to the ticket trying to explain your suggestion.
http://bugs.teechart.net/show_bug.cgi?id=644
Feel free to add a comment yourself explaining it better if you feel it's not accurate enough.
Errol wrote:For the second issue, I consider that the legend symbol text, after parsing and editing it, not being left-justified is an error. I note that TeeChart already has a property called Chart.Legend.TextAlignment which does not seem to do anything in this case. Surely it would be better to ensure this property does its job, rather than creating a new property, MarksAlignment that might get confused with general marks management ...
I'm sorry, I think I had this other issue in mind when I added the ticket to the tracker. I've just corrected the link on it.
Regarding the legend text alignment. I'll create a new ticket for it.
Best Regards,
ImageYeray Alonso
Development & Support
Steema Software
Av. Montilivi 33, 17003 Girona, Catalonia (SP)
Image Image Image Image Image Image Please read our Bug Fixing Policy

Post Reply