TeeChart VCL for Borland/CodeGear/Embarcadero RAD Studio, Delphi and C++ Builder.
-
Kai
- Newbie

- Posts: 11
- Joined: Tue Apr 01, 2014 12:00 am
Post
by Kai » Fri Apr 11, 2014 12:52 pm
We are using the TeeChartStandard2014 package.
I have a TBarSeries with some "double" values. I use this sample code:
Code: Select all
var
  i, j: Integer;
  tmpDates: array of TDateTime;
  doADoubleValue: Boolean;

   doADoubleValue := False;

   setLength(tmpDates, 2);

   for i:=0 to High(tmpDates) do
    if i mod 2 = 0 then
     tmpDates[i]:=IncDay(Today, i*2)
    else
     tmpDates[i]:=IncDay(Today, (i*2)+1);

    for i:=0 to 1 do
      with frmChart.ChartAccounting.AddSeries(TBarSeries) as TBarSeries do
       begin
        //MultiBar:=mbStacked;
        MarksOnBar:=False;
        MarksLocation:=mlCenter;
        CustomBarWidth:=40;

        XValues.DateTime:=true;

        for j:=0 to High(tmpDates) do
         begin
          if j mod 2 = 0 then
           begin
            AddXY(tmpDates[j]+i, 25+random*75, 'S' + inttoStr(i) + ' L' + IntToStr(j));
           end
          else
           begin
            AddXY(tmpDates[j], 25+random*75, 'S' + inttoStr(i) + ' L' + IntToStr(j));

            if not doADoubleValue then
             begin
              AddXY(tmpDates[j], 15+random*75, 'test - S' + inttoStr(i) + ' L' + IntToStr(j));
              doADoubleValue := True;
            end;
          end;
        end;
      end;
I looks like this:
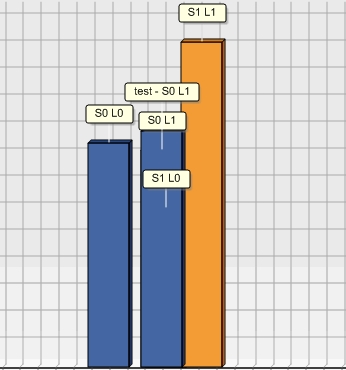
- test.jpg (38.55 KiB) Viewed 5341 times
So the bars with the same values are "overlayed". The same with "mbStacked".
Any idea how to fix this?
Best Regards,
Kai
-
Kai
- Newbie
- Posts: 11
- Joined: Tue Apr 01, 2014 12:00 am
Post
by Kai » Mon Apr 14, 2014 1:54 pm
I solved the problem with this solution:
Code: Select all
var
  i, j: Integer;
  tmpDates: array of TDateTime;
  doADoubleValue: Boolean;
  myColor: TColor;

   doADoubleValue := False;

   setLength(tmpDates, 2);

   for i:=0 to High(tmpDates) do
    if i mod 2 = 0 then
     tmpDates[i]:=IncDay(Today, i*2)
    else
     tmpDates[i]:=IncDay(Today, (i*2)+1);

    for i:=0 to 1 do
      with frmChart.ChartAccounting.AddSeries(TBarSeries) as TBarSeries do
       begin
        //MultiBar:=mbStacked;
        MarksOnBar:=False;
        MarksLocation:=mlCenter;
        CustomBarWidth:=40;

        XValues.DateTime:=true;

        myColor := Color;

        for j:=0 to High(tmpDates) do
         begin
          if j mod 2 = 0 then
           begin
            AddXY(tmpDates[j]+i, 25+random*75, 'S' + inttoStr(i) + ' L' + IntToStr(j));
           end
          else
           begin
            AddXY(tmpDates[j], 25+random*75, 'S' + inttoStr(i) + ' L' + IntToStr(j));

            if not doADoubleValue then
             begin
              with frmChart.ChartAccounting.AddSeries(TBarSeries) as TBarSeries do
              begin
               MultiBar:=mbStacked;
               MarksOnBar:=False;
               MarksLocation:=mlCenter;
               CustomBarWidth:=40;
               ShowInLegend := False;
               Color := myColor;

               AddXY(tmpDates[j], 15+random*75, 'test - S' + inttoStr(i) + ' L' + IntToStr(j), myColor);
              end;

              doADoubleValue := True;
            end;
          end;
        end;
      end;
I create a "new" series with the color of the "current" one. Then it works.
-
Yeray
- Site Admin

- Posts: 9534
- Joined: Tue Dec 05, 2006 12:00 am
- Location: Girona, Catalonia
-
Contact:
Post
by Yeray » Mon Apr 14, 2014 1:57 pm
Hello Kai,
With your code I get this, that is slightly different to your image:
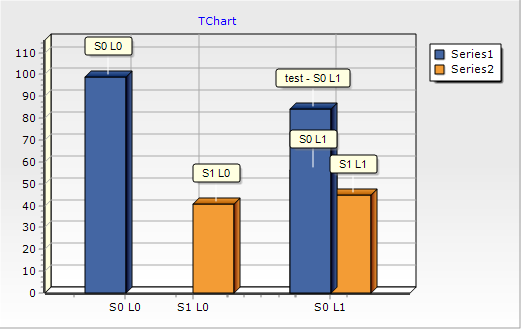
- 2014-04-14_1547.png (16.51 KiB) Viewed 5287 times
So I guess you are also modifying the bottom axis, setting a bigger range, making the bars to be drawn more close to the other bars.
On the other hand, looking at the data I see you are adding two values at the same XValue in Series1:
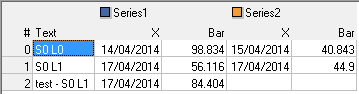
- data.png (2.79 KiB) Viewed 5293 times
Is that what you desired? If so, how would you expect the Bars to be drawn?
-
Yeray
- Site Admin
- Posts: 9534
- Joined: Tue Dec 05, 2006 12:00 am
- Location: Girona, Catalonia
-
Contact:
Post
by Yeray » Mon Apr 14, 2014 1:58 pm
Hello,
I see you already found how to solve it. I'm glad to hear you found it!

-
Kai
- Newbie
- Posts: 11
- Joined: Tue Apr 01, 2014 12:00 am
Post
by Kai » Mon Apr 14, 2014 2:07 pm
Hello Yeray,
we are posting at the same time

So I guess you are also modifying the bottom axis, setting a bigger range, making the bars to be drawn more close to the other bars.
Oh sorry ... i post only the code to add the bars.
On the other hand, looking at the data I see you are adding two values at the same XValue in Series1:
Is that what you desired?
Yes i have some values with the same XValue.
so the final looks like this:
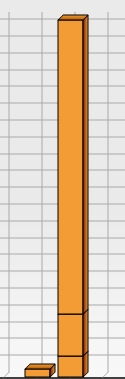
- screen.jpg (17.43 KiB) Viewed 5282 times
So erverthing works fine. Thanx.


