Page 1 of 1
Grid Increments greater than a year
Posted: Wed Oct 15, 2014 8:21 am
by 16469172
Hi
I am displaying monthly data from 1931 to 2014 and have set the bottom axis to a fixed one year increment. I have set the grid to medium grey and the minor grid to light grey and made the count to 11 to display vertical lines for each month. That works fine.
Now I would like to show a dark grey line every 10 years to delineate the decades i.e. 1940,1950 etc etc. To do this I try and set the top axis grid to show a dark grey vertical grid line by setting the increment to 3652.5 but because the series starts in 1931 for some reason it marks up the years 1939,1949 etc and not the decade start/end. Is there anyway I can make this work perhaps by some how manually controlling the grid drawing?
Bruce.
Re: Grid Increments greater than a year
Posted: Wed Oct 15, 2014 11:48 am
by yeray
Hi Bruce,
If I understand you correctly, you have something like this:
Code: Select all
uses Series, DateUtils;

procedure TForm1.FormCreate(Sender: TObject);
var i: Integer;
    tmpDate: TDate;
begin
  Chart1.Align:=alClient;

  Chart1.View3D:=false;
  Chart1.Legend.Visible:=false;

  with Chart1.AddSeries(TLineSeries) as TLineSeries do
  begin
    XValues.DateTime:=true;

    tmpDate:=StrToDate('1/1/1931');
    AddXY(tmpDate, 1000+random*50);
    for i:=1 to 2014-1931 do
    begin
      tmpDate:=IncYear(tmpDate);
      AddXY(tmpDate, YValue[i-1] + random*10-5);
    end;
  end;

  with Chart1.Axes.Bottom do
  begin
    Increment:=DateTimeStep[dtOneYear];
    DateTimeFormat:='yyyy';
    LabelsAngle:=90;
    MinorTickCount:=11;
    Grid.Color:=clMedGray;
    MinorGrid.Visible:=true;
    MinorGrid.Color:=clLtGray;
  end;
end;
That, zooming a bit looks like this:
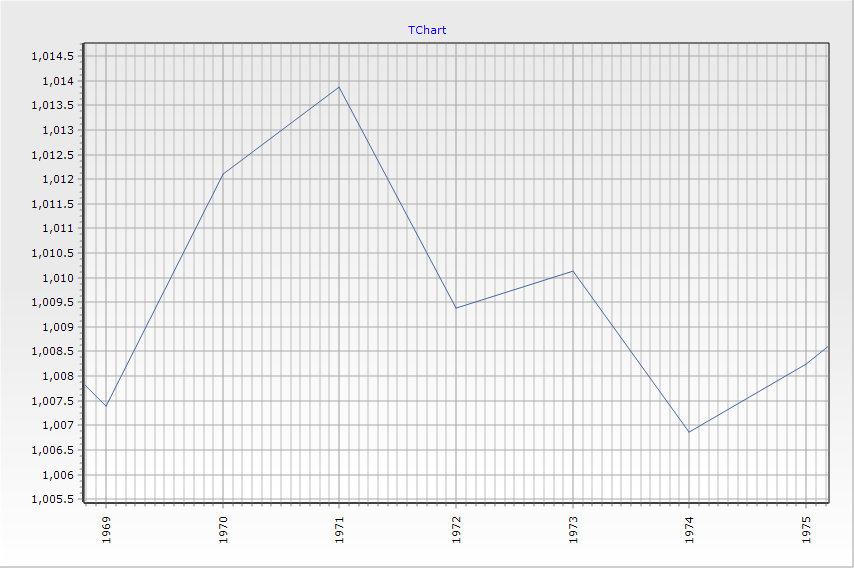
- test.png (26.85 KiB) Viewed 4885 times
To highlight the decades, you could use TColorLineTools:
Code: Select all
uses Series, DateUtils, TeeTools;

procedure TForm1.FormCreate(Sender: TObject);

  procedure addColorLineIfDecade(year: Integer);
  begin
    if year mod 10 = 0 then
      if (Chart1.Tools.Count=0) or
         ((Chart1.Tools[Chart1.Tools.Count-1] as TColorLineTool).Value<>year) then
         with Chart1.Tools.Add(TColorLineTool) as TColorLineTool do
         begin
           Axis:=Chart1.Axes.Bottom;
           Value:=StrToDate('1/1/'+IntToStr(year));
           AllowDrag:=false;
         end;
  end;

var i: Integer;
    tmpDate: TDate;
begin
  Chart1.Align:=alClient;

  Chart1.View3D:=false;
  Chart1.Legend.Visible:=false;

  with Chart1.AddSeries(TLineSeries) as TLineSeries do
  begin
    XValues.DateTime:=true;

    tmpDate:=StrToDate('1/1/1931');
    AddXY(tmpDate, 1000+random*50);
    addColorLineIfDecade(YearOf(tmpDate));
    for i:=1 to 2014-1931 do
    begin
      tmpDate:=IncYear(tmpDate);
      AddXY(tmpDate, YValue[i-1] + random*10-5);
      addColorLineIfDecade(YearOf(tmpDate));
    end;
  end;

  with Chart1.Axes.Bottom do
  begin
    Increment:=DateTimeStep[dtOneYear];
    DateTimeFormat:='yyyy';
    LabelsAngle:=90;
    MinorTickCount:=11;
    Grid.Color:=clMedGray;
    MinorGrid.Visible:=true;
    MinorGrid.Color:=clLtGray;
  end;
end;
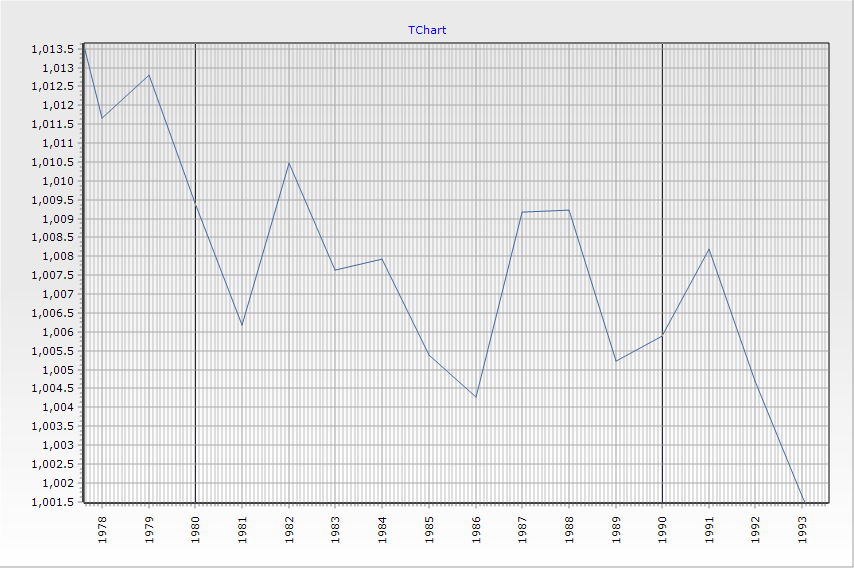
- test2.png (35.86 KiB) Viewed 4876 times
Re: Grid Increments greater than a year
Posted: Wed Oct 15, 2014 3:37 pm
by 16469172
Thanks Yeray

I thought that you must know the answer - I bet you've seen most of them in your job over the years
