Page 1 of 1
FastlineSeries Speedup
Posted: Tue Nov 25, 2014 3:04 pm
by 16568293
Hi,
I like to draw a series with many points, e.g. > 5 million points. Of course as quick as possible. So TFastLineSeries is anyway the right choice.
As the documentation lacks of details I wonder how to speed up the display but keeping the best visual information also with zooming.
There are the properties:
DrawAllPoints
DrawAllPointStyle
DrawStyle
FastPen
AutoRepaint
which seem to influence the behaviour and should be optimally set. Using DrawAllPointsStyle=daFirst seems to be unacceptable as it gives a wrong impression compared to DrawAllPoints=true.
So right now I use
DrawAllPoints := false;
DrawAllPointStyle=daMinMax;
DrawStyle=flAll; //what does it mean compared to flSegments ?
FastPen:= true; //is it only valid for old OS like XP ?
AutoPaint := true; //must the x-axis be prep'd before drawing ?
And what is PointerBehind ?
Thanks for any insights.
- Uli
Re: FastlineSeries Speedup
Posted: Tue Nov 25, 2014 4:13 pm
by yeray
Hello,
Note that drawing millions of points in a regular screen means that many points will be drawn in the same pixel.
That's why we implemented solutions like those you've found and some others:
DrawAllPoints property. See the example at "All features\Welcome !\Speed\Fast Line Speed DrawAll" (code here).TDownSampling function to reduce the number of points to draw. See the example at "All features\Welcome !\Functions\Extended\Reducing number of points" (code here).- Set the
TFastLineSeries DrawStyle property to flAll. This makes the whole series to be drawn at once instead of drawing it segment per segment.
- Non solid lines are very slow compared to solid lines. So make sure your series and axes
Pen.Style are set to psSolid.
- Disable AntiAlias. This can be done in two ways:
- At Chart level:
Code: Select all
(Chart1.Canvas as TGDIPlusCanvas).AntiAlias:=False;
- Implement as tips as possible from the ones explained in the Real-time Charting article here.
- Disable Hover feature if it's enabled:
- Use the
TSpeedTheme. See the example at "All features\Welcome !\Speed\Fast Line Speed DrawAll" (code here).
- Generally avoid drawing as many decoration elements as possible, specially gradients and texts. You can avoid drawing some axis labels setting bigger axis Increments.
The mentioned examples and other ones can be found in the features demo program shipped with the installation.
Re: FastlineSeries Speedup
Posted: Wed Nov 26, 2014 3:09 pm
by 16568293
Thanks for the information.
Unfortunately it does not give all answers.
My problem is that the chart must allow zooming. With DrawAllPoints:=false a series is quickly drawn. But then with zoom I get a wrong display.
See an example with not too many points (justabout 65000 points):
First the plot with all points with/without DrawAllPoints:
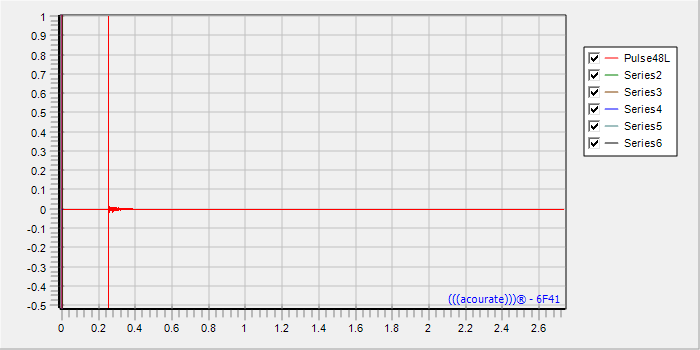
- DrawAllPoints := true;
or
DrawAllPoints := false; - Time1.png (11.15 KiB) Viewed 23559 times
Now with zoom
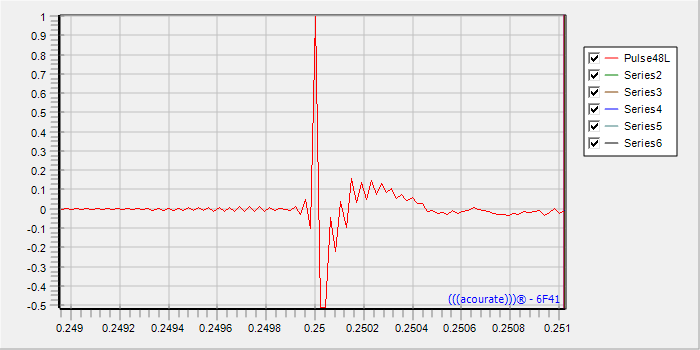
- DrawAllPoints := true;
- Time3.png (12.23 KiB) Viewed 23555 times
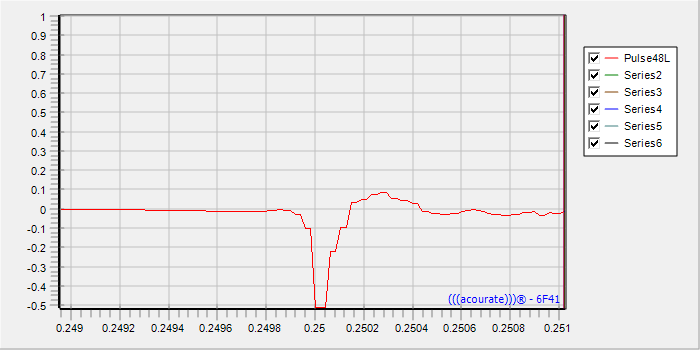
- DrawAllPoints := false;
- Time4.png (11.52 KiB) Viewed 23555 times
Obviously the last chart is wrong.
So this means that the quick chart is drawn by throwing away the points. With zoom the points are still gone.
Another approach would be to keep all the points but only to plot points with a different X pixel (in case of minmax two points may be drawn at the X position). Then with zoom the points need to get re-calculated again using only the data in the X range but applying the same approach of "pixel reduction".
Would that be possible?
- Uli
Re: FastlineSeries Speedup
Posted: Wed Nov 26, 2014 5:04 pm
by 16568293
I guess I made a wrong conclusion.
The first picture show the high amplitudes. So the data points are there.
But in the zoomed picture the high amplitudes disappear, despite DrawAllPointsStyle := daMinMax;
So it seems that with DrawAllPoints switched off DrawAllPointsStyle is no longer in use and thus it may be the reason for the missed high amplitude.
- Uli
Re: FastlineSeries Speedup
Posted: Thu Nov 27, 2014 9:33 am
by yeray
Hi Uli,
When DrawAllPoints=false the TFastLineSeries avoids drawing some points that would be drawn on the same X pixel.
DrawAllPointsStyle is used to choose between the given methods to handle the repetitions, only when DrawAllPoints is set to false.
daFirst method draws the first point on that X pixel and avoids drawing the later ones.
daMinMax draws 2 points, the Y min and Y max on that X pixel and avoids drawing the rest.
Both techniques considerably improve the performance when having many points. The cost to pay is that both techniques could result in strange results depending on the method chosen and the data given.
If you find one of the methods above isn't doing what it's expected to be done, please try to arrange a simple example project we can run as-is to reproduce the problem here.
If you find we could implement another method that would give a better result, don't hesitate to expose it here and we'll be pleased to study it.
Re: FastlineSeries Speedup
Posted: Sat Nov 29, 2014 3:11 pm
by 16568293
Yeray,
a simple example is to draw a chart with a TFastlineSeries. Simply add 50000 samples of Y-Value = 0 except sample 25000 = Y-Value = 1 and sample 25002 with Y-Value = -1
DrawAllPoints is ok but slow. Ok so far
Now we select DrawAllPoints=false, but DrawAllPointsStyle =daMinMax
So without zooming in the +/- 1 Y-Value is shown in the chart.
Now setting xmon=24950 amd xmax=25050 gives a wrong display.
I have tried to trace VclTee.Series but I do not understand the logic behind. So I do not have an idea, what is happening here.
- Uli
Re: FastlineSeries Speedup
Posted: Mon Dec 01, 2014 1:54 pm
by yeray
Hi Uli,
I've added it to the public tracker:
http://bugs.teechart.net/show_bug.cgi?id=1028
Re: FastlineSeries Speedup
Posted: Tue Jan 27, 2015 8:16 am
by 16571032
Yesterday I have got a test version of Series.pas by Narcís.
It solves the problem described by the example code but creates another problem.
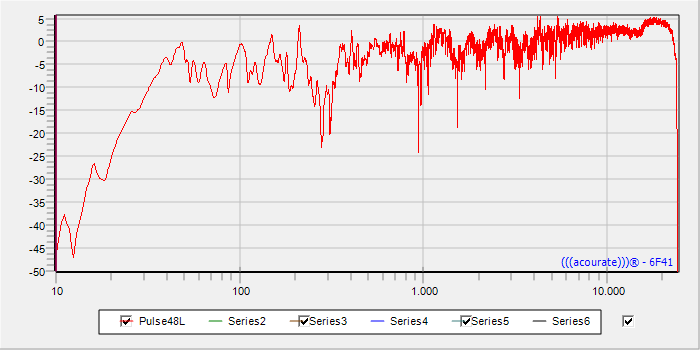
See an example of a frequency plot with 65537 points.
With DrawAllPoints = false the chart shows artifacts, see marked area
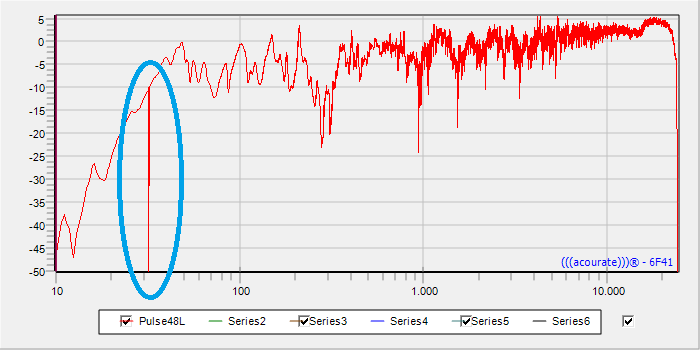
- AmplitudeDAPoff.png (14.75 KiB) Viewed 23331 times
With DrawAllPoints = true the chart looks ok
- AmplitudeDAPon.png (11.44 KiB) Viewed 23333 times
Uli
PS: please see also the wong legend display. I start another topic about this
Re: FastlineSeries Speedup
Posted: Tue Jan 27, 2015 10:08 am
by yeray
Hello,
The modification Narcís sent you seems to fix the example in the ticket
here, isn't it?
If you've noticed it is breaking a different case, please try to arrange a simple example project we can run as-is to reproduce the problematic situation here so we can study it.
Thanks in advance.
Re: FastlineSeries Speedup
Posted: Tue Jan 27, 2015 2:31 pm
by 16571032
Hello Yeray,,
Steema keeps me busy ...
Ok, in the attachment you find a small project SteemaTest.7Z and the example data in Mag.z7
You will understand it easily.
- Uli
Re: FastlineSeries Speedup
Posted: Wed Jan 28, 2015 11:23 am
by yeray
Hi Uli,
I'm sending you a mail with a modified version of Series.pas that seems to give a good result for the given dataset.
Could you please tell us if it fits your requirements?
Re: FastlineSeries Speedup
Posted: Wed Jan 28, 2015 12:19 pm
by 16571032
Hello Yeray,
many thanks

Up to now the new Series.pas works very well.
And it is indeed a speedup I have always searched for.
- Uli
Re: FastlineSeries Speedup
Posted: Thu Jan 29, 2015 8:50 am
by yeray
Hi Uli,
Thanks for the comment.
Don't hesitate to let us know if you find any problem with it.