Hi Alex,
Note there's a difference between both charts you've shown us. In the "needed" chart the red series shows strings, while in the "looks like" chart the red series shows values.
I've made a simple example trying to reproduce the situation:
Code: Select all
uses Chart, TeEngine, TeeGDIPlus, Series, Math;

var Chart1: TChart;

procedure TForm1.FormCreate(Sender: TObject);
var i: Integer;
begin
  Chart1:=TChart.Create(Self);
  Chart1.Parent:=Self;
  Chart1.Align:=alClient;

  Chart1.View3D:=false;
  Chart1.Color:=clWhite;

  with Chart1.AddSeries(TPointSeries) as TPointSeries do
  begin
    for i:=0 to 9 do
      Add(1, 'asdf');

    Marks.Transparent:=True;
    Marks.Visible:=True;
    Marks.Angle:=60;
    Marks.Callout.Length:=15;
    Marks.Callout.Arrow.Visible:=false;
    Marks.Font.Size:=9;

    Pointer.Style:=psDownTriangle;
  end;

  with Chart1.AddSeries(TPointSeries) as TPointSeries do
  begin
    for i:=0 to 9 do
      Add(2, FormatFloat('#,###,#0', Power(10, random*5)));

    Marks.Transparent:=True;
    Marks.Visible:=True;
    Marks.Angle:=60;
    Marks.Callout.Length:=15;
    Marks.Callout.Arrow.Visible:=false;

    Pointer.Style:=psDownTriangle;
  end;

  Chart1.Axes.Left.SetMinMax(0, 3);
  Chart1.Axes.Left.Grid.Visible:=false;
  Chart1.Axes.bottom.Grid.Visible:=false;
  Chart1.Axes.Bottom.MinimumOffset:=10;
  Chart1.Axes.Bottom.MaximumOffset:=10;
  Chart1.Axes.Left.Grid.Style:=psDot;
  Chart1.Axes.Bottom.LabelStyle:=talValue;
end;
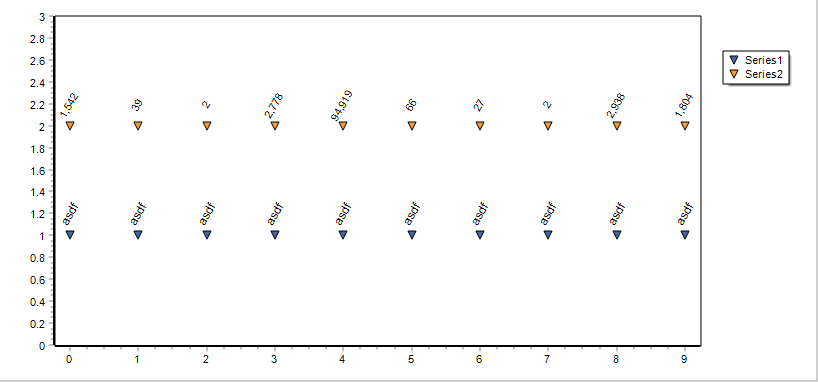
- 2014-12-19_1038.png (12.74 KiB) Viewed 3932 times
I'm afraid the Marks.Callout.Length property is unique per series. So, if you want it to change depending on the string width to be drawn, you'll have to change that property before drawing each mark, at Series OnGetMarkText event. Ie:
Code: Select all
//...
    OnGetMarkText:=SeriesGetMarkText;
//...
procedure TForm1.SeriesGetMarkText(Sender: TChartSeries; ValueIndex: Integer; var MarkText: String);
begin
  Sender.Marks.Callout.Length:=Chart1.Canvas.TextWidth(MarkText) div 2;
end;
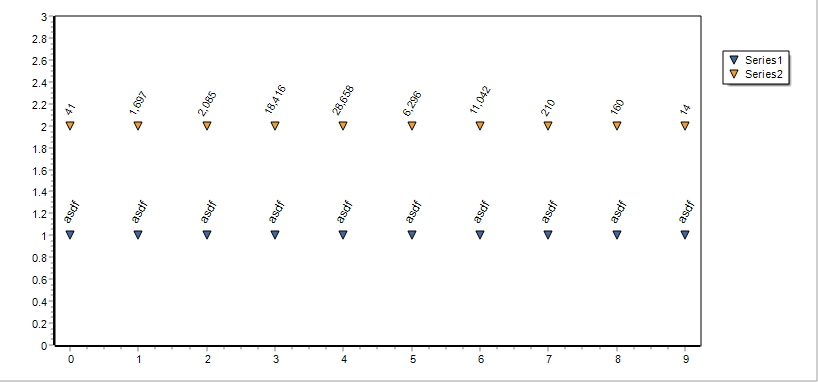
- 2014-12-19_1101.png (13.25 KiB) Viewed 3932 times


