Page 1 of 1
Marks Position
Posted: Thu Dec 18, 2014 8:55 am
by 16570473
Hi everybody.
We upgraded to TeeChart Pro v2012/14 VCL which is basically very nice!
But we do have a problem with the alignment of the text of marks, which used to work in previous version. We need marks to be in an angle of 60deg on top of the point; and they should be transparent (no box, no border). All right so far, but the mark covers the point and we can't get it to be aligned on top of the point.
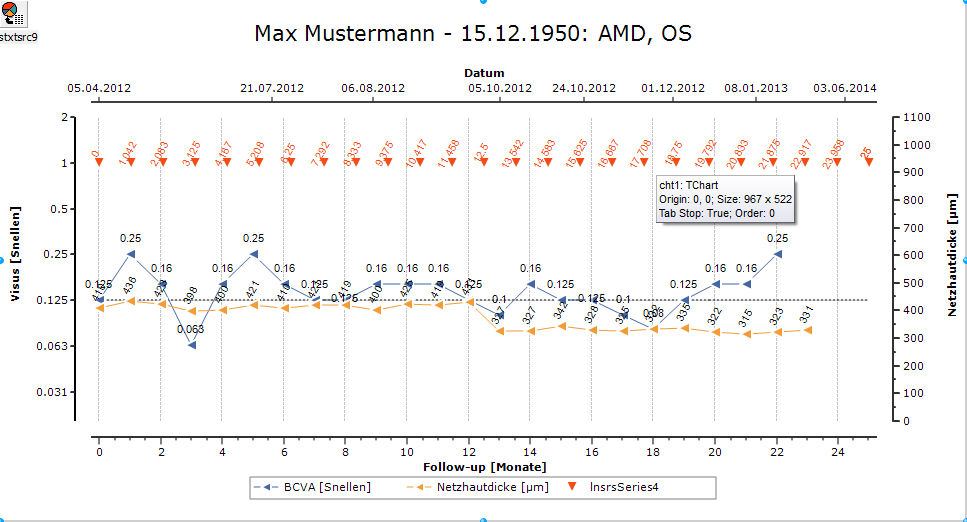
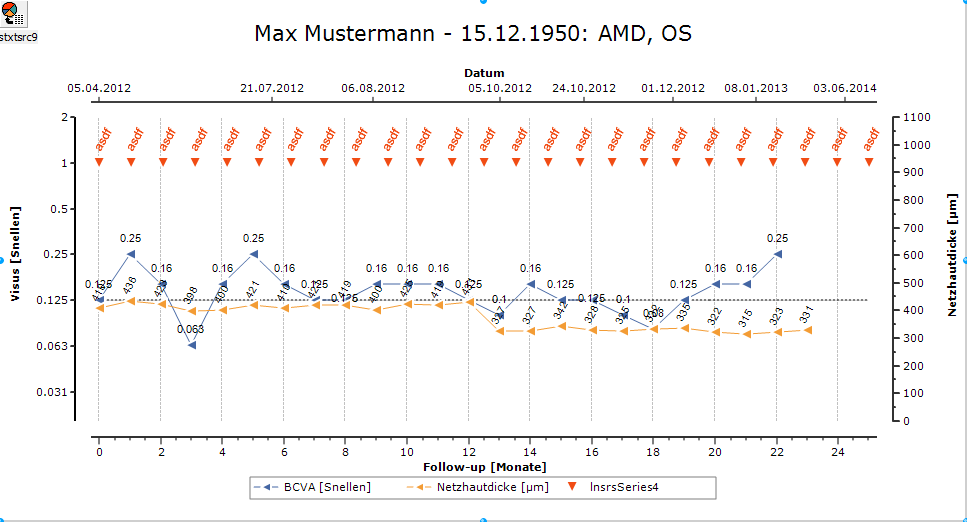
Please see the two attached images for better understanding. Its about the red series.
*

- thats a screenshot of what it looks like
- marks1.png (46.86 KiB) Viewed 3987 times
*

- thats a made up mockup of what we need
- marks2.png (129.5 KiB) Viewed 3987 times
Thanks for any help or hint on how to solve that.
Alex
Re: Marks Position
Posted: Fri Dec 19, 2014 10:01 am
by yeray
Hi Alex,
Note there's a difference between both charts you've shown us. In the "needed" chart the red series shows strings, while in the "looks like" chart the red series shows values.
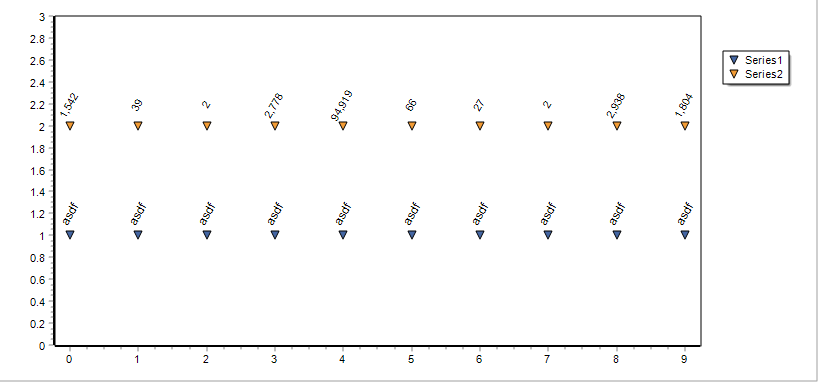
I've made a simple example trying to reproduce the situation:
Code: Select all
uses Chart, TeEngine, TeeGDIPlus, Series, Math;

var Chart1: TChart;

procedure TForm1.FormCreate(Sender: TObject);
var i: Integer;
begin
  Chart1:=TChart.Create(Self);
  Chart1.Parent:=Self;
  Chart1.Align:=alClient;

  Chart1.View3D:=false;
  Chart1.Color:=clWhite;

  with Chart1.AddSeries(TPointSeries) as TPointSeries do
  begin
    for i:=0 to 9 do
      Add(1, 'asdf');

    Marks.Transparent:=True;
    Marks.Visible:=True;
    Marks.Angle:=60;
    Marks.Callout.Length:=15;
    Marks.Callout.Arrow.Visible:=false;
    Marks.Font.Size:=9;

    Pointer.Style:=psDownTriangle;
  end;

  with Chart1.AddSeries(TPointSeries) as TPointSeries do
  begin
    for i:=0 to 9 do
      Add(2, FormatFloat('#,###,#0', Power(10, random*5)));

    Marks.Transparent:=True;
    Marks.Visible:=True;
    Marks.Angle:=60;
    Marks.Callout.Length:=15;
    Marks.Callout.Arrow.Visible:=false;

    Pointer.Style:=psDownTriangle;
  end;

  Chart1.Axes.Left.SetMinMax(0, 3);
  Chart1.Axes.Left.Grid.Visible:=false;
  Chart1.Axes.bottom.Grid.Visible:=false;
  Chart1.Axes.Bottom.MinimumOffset:=10;
  Chart1.Axes.Bottom.MaximumOffset:=10;
  Chart1.Axes.Left.Grid.Style:=psDot;
  Chart1.Axes.Bottom.LabelStyle:=talValue;
end;

- 2014-12-19_1038.png (12.74 KiB) Viewed 3945 times
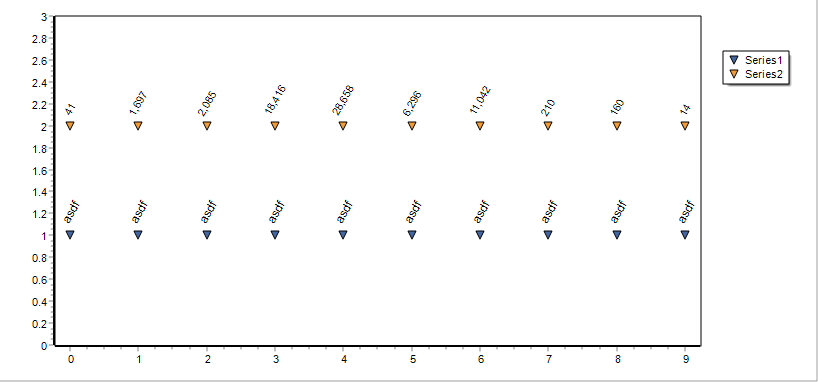
I'm afraid the Marks.Callout.Length property is unique per series. So, if you want it to change depending on the string width to be drawn, you'll have to change that property before drawing each mark, at Series OnGetMarkText event. Ie:
Code: Select all
//...
    OnGetMarkText:=SeriesGetMarkText;
//...
procedure TForm1.SeriesGetMarkText(Sender: TChartSeries; ValueIndex: Integer; var MarkText: String);
begin
  Sender.Marks.Callout.Length:=Chart1.Canvas.TextWidth(MarkText) div 2;
end;

- 2014-12-19_1101.png (13.25 KiB) Viewed 3945 times