logarithmic bottom axis

TeeChart VCL for Borland/CodeGear/Embarcadero RAD Studio, Delphi and C++ Builder.
Post Reply
strobbekoen
Newbie
Newbie
Posts: 23
Joined: Tue Feb 10, 2009 12:00 am

logarithmic bottom axis

Post by strobbekoen » Thu Feb 05, 2015 12:36 pm

Hi,

I am having some issues configuring a bottom axis in logarithmic mode.
I have a dataset of points (x,y). The x values are time in minutes, from 5 seconds to 60minutes.
The time points are:
between 5" and 1' : per 5 seconds
between 1' and 10' : per 1 minute
between 10' and 60' : per 5 minutes
So, there are more points with shorter times than longer times.

I have attached two screenshots
1st is the graph in non-logarithmic mode where the x-axis is divided into 10' increments
2nd is logarithmic mode, also divided in 10' increments
I set the bottom axis min/max values myself = 5/60 .. 60, or from 5" to 60'
The problem I have is that changing the LogarithmicBase property does not change anything how the bottom axis is scaled. Set it to 2 or 100, no difference.
I would like to scale it so the first 10 minutes is less spread out.
iqo2_log1.jpg
1st
iqo2_log1.jpg (147.88 KiB) Viewed 6898 times
iqo2_log2.jpg
2nd
iqo2_log2.jpg (148.14 KiB) Viewed 6904 times

Yeray
Site Admin
Site Admin
Posts: 9534
Joined: Tue Dec 05, 2006 12:00 am
Location: Girona, Catalonia
Contact:

Re: logarithmic bottom axis

Post by Yeray » Fri Feb 06, 2015 9:55 am

Hello,

I've made a simple example project trying to reproduce the situation described. Could you please check it?
testLog.zip
(2.15 KiB) Downloaded 518 times
strobbekoen wrote:The problem I have is that changing the LogarithmicBase property does not change anything how the bottom axis is scaled. Set it to 2 or 100, no difference.
I would like to scale it so the first 10 minutes is less spread out.
When Logarithmic is active, I see the labels changing when modifying the Increment/LogarithmicBase but the series points don't change, is that what you mean?
Best Regards,
ImageYeray Alonso
Development & Support
Steema Software
Av. Montilivi 33, 17003 Girona, Catalonia (SP)
Image Image Image Image Image Image Please read our Bug Fixing Policy

strobbekoen
Newbie
Newbie
Posts: 23
Joined: Tue Feb 10, 2009 12:00 am

Re: logarithmic bottom axis

Post by strobbekoen » Fri Feb 06, 2015 10:28 am

Yes, I want to be able to scale the axis and the points.

Yeray
Site Admin
Site Admin
Posts: 9534
Joined: Tue Dec 05, 2006 12:00 am
Location: Girona, Catalonia
Contact:

Re: logarithmic bottom axis

Post by Yeray » Mon Feb 09, 2015 10:10 am

Hello,

I understand you'd like the axis scale (and the series drawn) to follow a log scale with customizable base, but I'm not sure if this is mathematically coherent or possible.
I can't find examples of this kind of charts, can you?
Best Regards,
ImageYeray Alonso
Development & Support
Steema Software
Av. Montilivi 33, 17003 Girona, Catalonia (SP)
Image Image Image Image Image Image Please read our Bug Fixing Policy

Yeray
Site Admin
Site Admin
Posts: 9534
Joined: Tue Dec 05, 2006 12:00 am
Location: Girona, Catalonia
Contact:

Re: logarithmic bottom axis

Post by Yeray » Tue Feb 10, 2015 3:03 pm

Hello again,

After discussing with my colleagues and after some research, I believe TeeChart is doing it well.

Take a look at this article where Jon Peltier explains how the log scale works in Excel and what to expect when changing the base (you can jump directly to the Excel 2007 part).

The data:
1, 1.5
2, 2.75
3, 5
4, 9
5, 17
6, 32
7, 60

The post entry starts with this:
Here’s the data in a default XY chart.
linear_excel.png
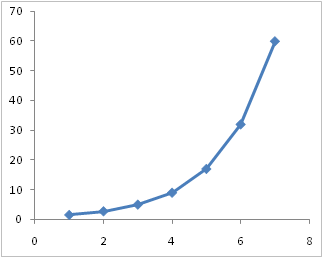
linear_excel.png (6.61 KiB) Viewed 6794 times
And here it is what I get if I load the data above in a TLineSeries with the default axes (I just change the min and max and some minor setting for aesthetics):

Code: Select all

uses Series;

procedure TForm1.FormCreate(Sender: TObject);
begin
  Chart1.View3D:=false;
  Chart1.Legend.Visible:=false;

  with Chart1.AddSeries(TLineSeries) as TLineSeries do
  begin
    Pointer.Visible:=true;
    Pointer.Pen.Visible:=false;
    Pointer.Style:=psDiamond;

    AddXY(1, 1.5);
    AddXY(2, 2.75);
    AddXY(3, 5);
    AddXY(4, 9);
    AddXY(5, 17);
    AddXY(6, 32);
    AddXY(7, 60);
  end;

  Chart1.Axes.Bottom.Grid.Visible:=false;
  Chart1.Axes.Bottom.SetMinMax(0, 8);

  Chart1.Axes.Left.Grid.Visible:=false;
  Chart1.Axes.Left.SetMinMax(0, 70);
end;
linear.png
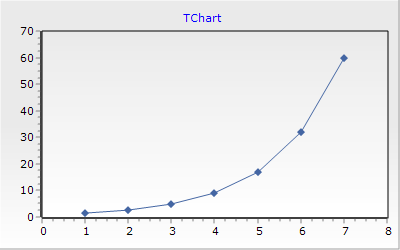
linear.png (8.27 KiB) Viewed 6790 times
The article continues with this:
Here’s the data with the default base-10 log axis scale.
log10_excel.png
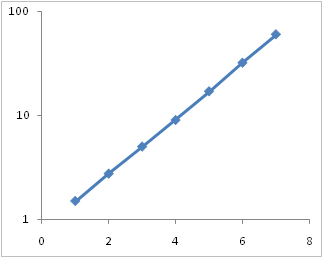
log10_excel.png (5.83 KiB) Viewed 6789 times
And this is what I get if I set the left axis to be logarithmic

Code: Select all

uses Series;

procedure TForm1.FormCreate(Sender: TObject);
begin
  Chart1.View3D:=false;
  Chart1.Legend.Visible:=false;

  with Chart1.AddSeries(TLineSeries) as TLineSeries do
  begin
    Pointer.Visible:=true;
    Pointer.Pen.Visible:=false;
    Pointer.Style:=psDiamond;

    AddXY(1, 1.5);
    AddXY(2, 2.75);
    AddXY(3, 5);
    AddXY(4, 9);
    AddXY(5, 17);
    AddXY(6, 32);
    AddXY(7, 60);
  end;

  Chart1.Axes.Bottom.Grid.Visible:=false;
  Chart1.Axes.Bottom.SetMinMax(0, 8);

  Chart1.Axes.Left.Grid.Visible:=false;
  Chart1.Axes.Left.Logarithmic:=true;
  Chart1.Axes.Left.SetMinMax(0, 100);
end;
log10.png
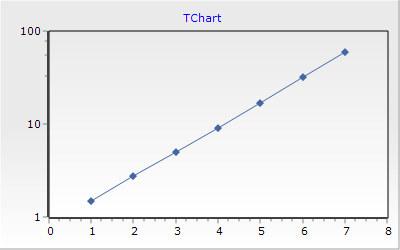
log10.png (6.79 KiB) Viewed 6806 times
The article ends with this:
Here is the chart with a base 2 log axis scale.
log2_excel.png
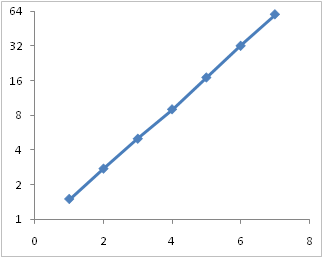
log2_excel.png (6.53 KiB) Viewed 6784 times
And this is what I get if I change to log base 2:

Code: Select all

uses Series;

procedure TForm1.FormCreate(Sender: TObject);
begin
  Chart1.View3D:=false;
  Chart1.Legend.Visible:=false;

  with Chart1.AddSeries(TLineSeries) as TLineSeries do
  begin
    Pointer.Visible:=true;
    AddXY(1, 1.5);
    AddXY(2, 2.75);
    AddXY(3, 5);
    AddXY(4, 9);
    AddXY(5, 17);
    AddXY(6, 32);
    AddXY(7, 60);
  end;

  Chart1.Axes.Bottom.Grid.Visible:=false;
  Chart1.Axes.Bottom.SetMinMax(0, 8);

  Chart1.Axes.Left.Grid.Visible:=false;
  Chart1.Axes.Left.Logarithmic:=true;
  Chart1.Axes.Left.LogarithmicBase:=2;
  Chart1.Axes.Left.SetMinMax(1, 64);
end;
log2.png
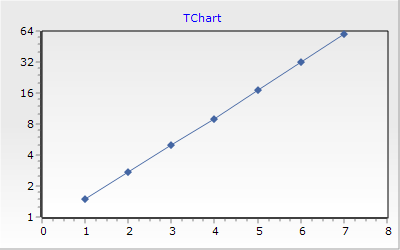
log2.png (7.91 KiB) Viewed 6795 times
Best Regards,
ImageYeray Alonso
Development & Support
Steema Software
Av. Montilivi 33, 17003 Girona, Catalonia (SP)
Image Image Image Image Image Image Please read our Bug Fixing Policy

Post Reply