Page 1 of 1
Stacked bar charts not auto-scaled
Posted: Fri May 01, 2015 6:19 am
by 16566546
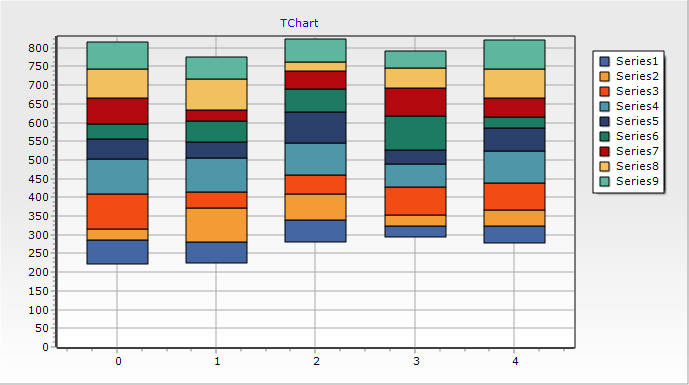
I use stacked bar charts to represent well lithology. Rather than starting at zero, the vertical origin of the charts are offset by an amount corresponding to the elevation of the wellhead. However, when I plot the charts they do not auto-scale but run off the top of the chart, as shown. Any idea why this might be happening? The elevations of the wells are 282, 282, 292, 292 and 206 m respectively.
Re: Stacked bar charts not auto-scaled
Posted: Tue May 05, 2015 8:44 am
by yeray
Hello,
You can set a different Origin for each TBarSeries but I understand you need to set an offset for each value.
Then, you'll need to use TBar3DSeries instead of TBarSeries. Just note that with them you'll have to play with the offsets to manually synchronize the offset of each value matching predecessor series values+offset. Ie:
Code: Select all
procedure TForm1.FormCreate(Sender: TObject);
var i, j, n: Integer;
    tmp: Double;
begin
  Chart1.View3D:=false;

  for i:=0 to 8 do
    with Chart1.AddSeries(TBar3DSeries) as TBar3DSeries do
    begin
      for j:=0 to 4 do
      begin
        if (i=0) then
          tmp:=200+random*100
        else
          tmp:=(Chart1[0] as TBar3DSeries).OffsetValues[j];

        for n:=0 to Chart1.SeriesCount-2 do
          tmp:=tmp+Chart1[n].YValue[j];

        AddBar(j, 25+random*75, tmp);
      end;
      MultiBar:=mbStacked;
      Marks.Visible:=false;
    end;
end;
- 2015-05-05_1044.png (20.1 KiB) Viewed 5272 times
Re: Stacked bar charts not auto-scaled
Posted: Tue May 12, 2015 11:53 pm
by 16566546
Hello Yeray. Thanks for your reply but I think we may be talking at cross-purposes here, probably because I did not explain well enough. We have developed a UnitBarSeries unit with which I am able to offset the bar charts correctly simply by setting a YPosition variable for each chart, which corresponds to the elevation of each well. See attachment with the charts dragged down to show the tops of each bar chart. However, when I unzoom, the charts go off the top of the graph, by a small amount as shown in the previous post. How can I control automatic scaling to show the whole graph?
Re: Stacked bar charts not auto-scaled
Posted: Wed May 13, 2015 10:38 am
by yeray
Hello,
Errol wrote:Thanks for your reply but I think we may be talking at cross-purposes here, probably because I did not explain well enough. We have developed a UnitBarSeries unit with which I am able to offset the bar charts correctly simply by setting a YPosition variable for each chart, which corresponds to the elevation of each well. See attachment with the charts dragged down to show the tops of each bar chart. However, when I unzoom, the charts go off the top of the graph, by a small amount as shown in the previous post. How can I control automatic scaling to show the whole graph?
Try overriding these functions on your UnitBarSeries:
Code: Select all
    Function MinYValue:Double; override;
    Function MaxYValue:Double; override;
That's how the TErrorBarSeries adds extra margin on the vertical axis to fit the error line.