Graphical behaviour of THistogramSeries changed

TeeChart VCL for Borland/CodeGear/Embarcadero RAD Studio, Delphi and C++ Builder.
Post Reply
Whookie
Newbie
Newbie
Posts: 25
Joined: Fri Jan 07, 2011 12:00 am

Graphical behaviour of THistogramSeries changed

Post by Whookie » Tue Sep 15, 2015 1:30 pm

This seems to go back beyond the last two major updates, but was reported by a customer.

Back then the THistogramSeries looked like this:
old_histo.png
old_histo.png (19.19 KiB) Viewed 16137 times
With - at least - the last two versions (I can't go back this far with my project) it looks like this:
new_hist.png
new_hist.png (50.77 KiB) Viewed 16135 times
As you can see the historam seems to be a TBarSeries with connected bars rather then a histogram. This is especially bad as - when more data gets added - only the border can be seen now (losing all the red areas!!).

I couln'd find an option to turn the old behaviour back on so I hope you do have that hidden somewhere - or can at least give me a patch do bring this back on!

In addition with the latest (Delphi Seattle) Version there is also an ugly offset, shifting the top border a few pixels to the right:
curr_hist.png
curr_hist.png (2.19 KiB) Viewed 16119 times


TIA

Yeray
Site Admin
Site Admin
Posts: 9533
Joined: Tue Dec 05, 2006 12:00 am
Location: Girona, Catalonia
Contact:

Re: Graphical behaviour of THistogramSeries changed

Post by Yeray » Wed Sep 16, 2015 11:51 am

Hello,

Do you have a simple example project we can run as-is to reproduce the problem here?
Thanks in advance.
Best Regards,
ImageYeray Alonso
Development & Support
Steema Software
Av. Montilivi 33, 17003 Girona, Catalonia (SP)
Image Image Image Image Image Image Please read our Bug Fixing Policy

Whookie
Newbie
Newbie
Posts: 25
Joined: Fri Jan 07, 2011 12:00 am

Re: Graphical behaviour of THistogramSeries changed

Post by Whookie » Wed Sep 16, 2015 1:18 pm

I added a demo project (and an exe-File which needs all the run time packages).

If you just run it as it is it generates 400 Samples and marks any value below 500 in red this looks like this:
A.png
A.png (8.93 KiB) Viewed 16091 times
I can't reproduce old behavior but the screen-shot from the last post was taken from an older version of my software.

I found out that removing the border does show the correct values (uncheck "Use Border") but then the bold outline is also gone and it looks like this:
B.png
B.png (9.55 KiB) Viewed 16082 times
Please see following post (as there is a limit of 3 files per post)...
Attachments
TChar_Hist.7z
(105.1 KiB) Downloaded 671 times

Whookie
Newbie
Newbie
Posts: 25
Joined: Fri Jan 07, 2011 12:00 am

Re: Graphical behaviour of THistogramSeries changed

Post by Whookie » Wed Sep 16, 2015 1:33 pm

...follow up

No if you use 30 samples and turn the border back on you get:
C.png
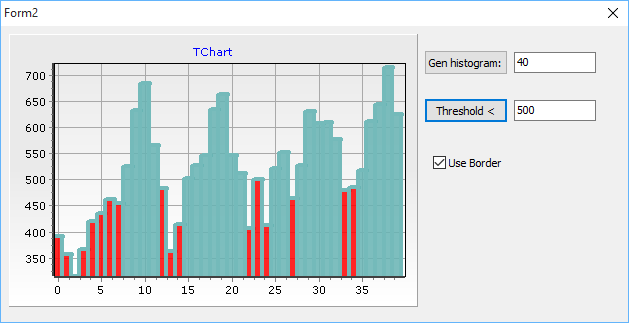
C.png (9.88 KiB) Viewed 16080 times
Which shows the "bar-like" border and the shifted offset at the top...

Note: When experimenting you might need to press "Gen histogram:" a few times to get one with values below and above the current threshold! In addition you need to click "Threshold <" after generating a new histogram (or else all values stay in the original color).


While at it, I also found out that the Transparency of the border it self doesn't work and has a real strange behaviour:

Open the bars options:
btransp.png
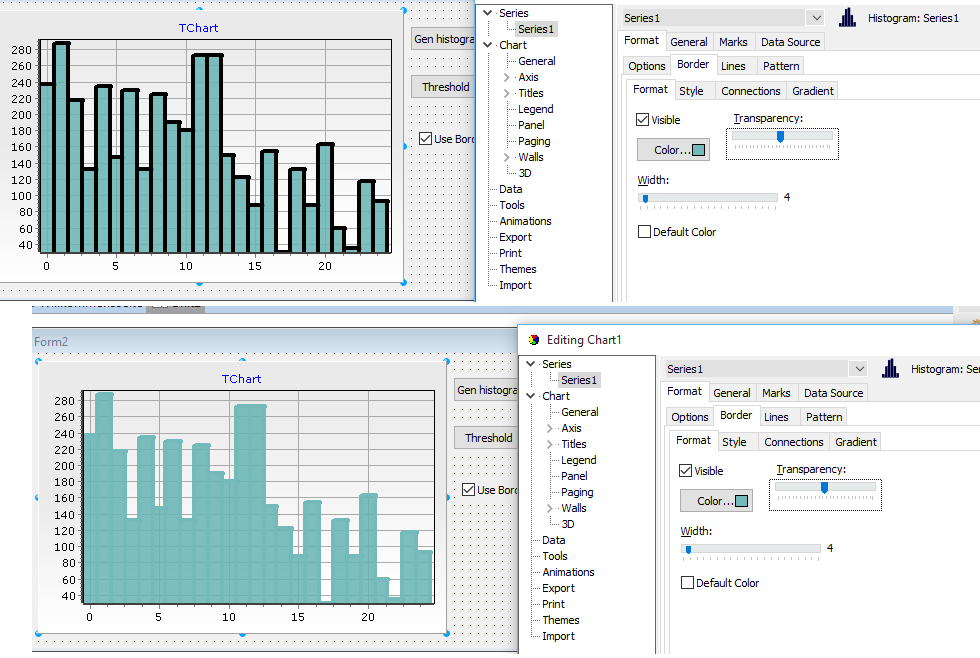
btransp.png (54.65 KiB) Viewed 16077 times
like in the image above, klick the "Transpareny:" Trackbar und use the left-/right cursor keys of your keyboard to increment or decrement that Transparency value just by 1 each time.
This was the border "flips" between the selected color and black back and force with each value change.
If you compile and run the application there is no transparency of the border either way but in "black"-State it looks like this (showing the shift bug even sharper):
D.png
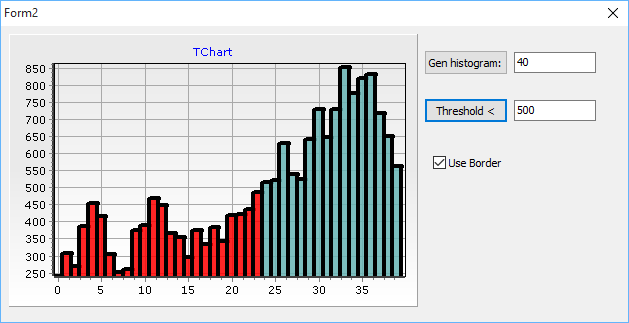
D.png (9.97 KiB) Viewed 16071 times
Note: I do not yous border transparency as I liked the old behaviour of the histogram, having a bold - nontransparent - outline and a proper colord semi-transparent interior.

Yeray
Site Admin
Site Admin
Posts: 9533
Joined: Tue Dec 05, 2006 12:00 am
Location: Girona, Catalonia
Contact:

Re: Graphical behaviour of THistogramSeries changed

Post by Yeray » Wed Sep 16, 2015 2:25 pm

Hello,

I can see the border issue, but I can reproduce it with v2015.15 down to v2012.07.
Could you please specify with what TeeChart version this behaviour was different?
Best Regards,
ImageYeray Alonso
Development & Support
Steema Software
Av. Montilivi 33, 17003 Girona, Catalonia (SP)
Image Image Image Image Image Image Please read our Bug Fixing Policy

Whookie
Newbie
Newbie
Posts: 25
Joined: Fri Jan 07, 2011 12:00 am

Re: Graphical behaviour of THistogramSeries changed

Post by Whookie » Thu Sep 17, 2015 8:10 am

I was lucky to find an older installation on my PC to show you how THistogramSeries worked before it got broken:
Old_Behaviour.png
Old_Behaviour.png (57.45 KiB) Viewed 16060 times
In fact I was able to install a newer version of TChart and there its working too:
Old_Behaviour2012.05.png
Old_Behaviour2012.05.png (37.52 KiB) Viewed 16052 times
...and as I was at it, I installed 2014.10 which also seems to be ok:
Old_Behaviour 2014.png
Old_Behaviour 2014.png (43.34 KiB) Viewed 16064 times

Yeray
Site Admin
Site Admin
Posts: 9533
Joined: Tue Dec 05, 2006 12:00 am
Location: Girona, Catalonia
Contact:

Re: Graphical behaviour of THistogramSeries changed

Post by Yeray » Thu Sep 17, 2015 1:33 pm

Hello,

I see the problem appeared in v2014.12.
I've created a ticket for it and found a fix, so the next maintenance release will include it.
http://bugs.teechart.net/show_bug.cgi?id=1310

I also see the issue regarding the "ugly offset" has always been like that, isn't it?
Best Regards,
ImageYeray Alonso
Development & Support
Steema Software
Av. Montilivi 33, 17003 Girona, Catalonia (SP)
Image Image Image Image Image Image Please read our Bug Fixing Policy

Whookie
Newbie
Newbie
Posts: 25
Joined: Fri Jan 07, 2011 12:00 am

Re: Graphical behaviour of THistogramSeries changed

Post by Whookie » Fri Sep 18, 2015 8:53 am

Yeray wrote:I also see the issue regarding the "ugly offset" has always been like that, isn't it?
Strange enough! I back checked with screen-shots from an older Version (the one in my initial post):
old_n_full.png
old_n_full.png (270.83 KiB) Viewed 16033 times
Even though its not of superior quality you can zoom in and see that there are "sharp" edges but maybe this impression is supported by the selection of colors. I'm pretty sure, that I never had that great offset i can see now (its also because the original software uses 3 as border width and my initial example used 4 - to make it better visible).

I found another screen shot and it seems that there is no offset either:
last_working.png
last_working.png (75.88 KiB) Viewed 16036 times
This is strange as that was made with my application released in May 2015 (compiled with XE7 and - thats what I'm not 100% sure off - a 2014.?? version of TChart).

I'm sorry but at the moment I cannot get better quality images, because there is an extensive machine required to get the data needed.

Yeray
Site Admin
Site Admin
Posts: 9533
Joined: Tue Dec 05, 2006 12:00 am
Location: Girona, Catalonia
Contact:

Re: Graphical behaviour of THistogramSeries changed

Post by Yeray » Tue Sep 22, 2015 2:38 pm

Hello,

Excuse us for the delayed reply here.

If we could get access to the full code that gives a different result if would help us to check what's the difference in TeeChart's sources, if any.
We've seen setting a different Pen.EndStyle doesn't give that "offset". Could you please check if it gives the result you desire?

Code: Select all

Histogram1.Pen.EndStyle:=esFlat;
Best Regards,
ImageYeray Alonso
Development & Support
Steema Software
Av. Montilivi 33, 17003 Girona, Catalonia (SP)
Image Image Image Image Image Image Please read our Bug Fixing Policy

Whookie
Newbie
Newbie
Posts: 25
Joined: Fri Jan 07, 2011 12:00 am

Re: Graphical behaviour of THistogramSeries changed

Post by Whookie » Wed Sep 23, 2015 11:43 am

Hi,
I'm sorry, I tried to go back and rebuild the Application but got stuck on some stuff not compiling anymore, so I had to give up for now.

I also tried your suggestion but setting the connection end style to flat produces "steps" instead of an offset.
flat.png
flat.png (14.91 KiB) Viewed 15962 times
in conjunction with a border width of 3 they have just the size of a pixel (so that would be acceptable) but with thicker borders its highly visible (see attachment).

Yeray
Site Admin
Site Admin
Posts: 9533
Joined: Tue Dec 05, 2006 12:00 am
Location: Girona, Catalonia
Contact:

Re: Graphical behaviour of THistogramSeries changed

Post by Yeray » Thu Sep 24, 2015 11:54 am

Hello,

I've created a new ticket in the public tracker explaining the issue with these corners in the THistogramSeries:
http://bugs.teechart.net/show_bug.cgi?id=1320
Best Regards,
ImageYeray Alonso
Development & Support
Steema Software
Av. Montilivi 33, 17003 Girona, Catalonia (SP)
Image Image Image Image Image Image Please read our Bug Fixing Policy

Post Reply