TeeChart VCL for Borland/CodeGear/Embarcadero RAD Studio, Delphi and C++ Builder.
-
Softdrill NL
- Newbie

- Posts: 6
- Joined: Mon Dec 21, 2015 12:00 am
Post
by Softdrill NL » Tue Apr 19, 2016 12:48 pm
Hello,
I am trying to achieve a chart output similar to format shown below (hand-drawn to give you an idea).
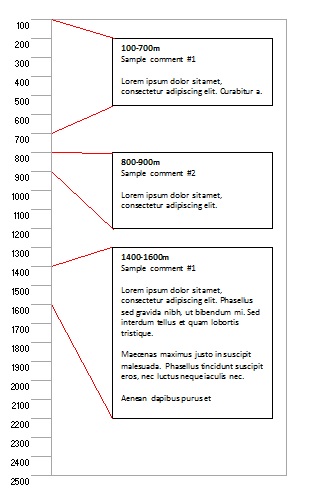
- Sample chart.jpg (44.06 KiB) Viewed 4769 times
The general idea is that the left (inverted) axis relates to a depth. I am trying to plot comment boxes that relate to specific depths / depth ranges. I have tried TAnnotationTool, TRectangleTool and a ShapeSeries. When the chart is zoomed/scrolled the text boxes must be scaled / displayed accordingly.
So far the ShapeSeries appears to give the best result, but unfortunately HTML text output is not supported. Do you have any ideas / recommendations how to achieve such a chart? I am a relative newbie, so some guides is likely to save me a lot of time!
Thanks in advance. Regards,
Mark
-
Yeray
- Site Admin

- Posts: 9534
- Joined: Tue Dec 05, 2006 12:00 am
- Location: Girona, Catalonia
-
Contact:
Post
by Yeray » Wed Apr 20, 2016 12:39 pm
Hi Mark,
You could try doing something like this:
Code: Select all
uses TeeShape;

type
  TMyRectShape = class(TChartShape)
  private
    Shape: TTextShape;
  protected
    procedure DrawValue(ValueIndex:Integer); override;

  public
   Constructor Create(AOwner : TComponent); override;
end;

type
  TShapeAccess=class(TCustomTextShape);

Constructor TMyRectShape.Create(AOwner : TComponent);
begin
  inherited;

  Shape:=TTextShape.Create(ParentChart) as TTextShape;
  with Shape do
  begin
    TextFormat:=ttfHtml;
    AutoSize:=false;
    Brush.Clear;
  end;
end;

procedure TMyRectShape.DrawValue(ValueIndex:Integer);
var tmpS      : String;
begin
  tmpS:=Text.Text;
  Text.Clear;
  inherited;
  Text.Text:=tmpS;

  Shape.Text:=tmpS;
  Shape.ShapeBounds:=Bounds;
  TShapeAccess(Shape).CalcBounds(ParentChart);
  Shape.Draw;
end;


procedure TForm1.FormCreate(Sender: TObject);
begin
  Chart1.View3D:=false;
  Chart1.Legend.Visible:=false;

  with Chart1.AddSeries(TMyRectShape) as TMyRectShape do
  begin
    Style:=chasRectangle;
    Shape.ParentChart:=Chart1;

    Text.Add('<b>Hello</b>');
    Text.Add('<br><font color=GREEN size=8>This is a shape</font>');
    Text.Add('<br><font color=Blue size=15>with html text</font>');

    X0:=10;
    X1:=50;
    Y0:=20;
    Y1:=40;
  end;

  Chart1.Axes.Left.Grid.Visible:=false;
  Chart1.Axes.Left.Inverted:=true;
  Chart1.Axes.Left.SetMinMax(0,100);
  Chart1.Axes.Bottom.SetMinMax(0,100);
  Chart1.Axes.Bottom.Visible:=false;
end;


