TeeChart VCL for Borland/CodeGear/Embarcadero RAD Studio, Delphi and C++ Builder.
-
X-ray
- Newbie

- Posts: 8
- Joined: Mon Jan 25, 2016 12:00 am
Post
by X-ray » Thu Jul 14, 2016 9:45 am
Hello,
there seems to be a problem with the (X) position of points in the graphics.
Or I am overlooking something. The series values that are plotted are all on the same X value:
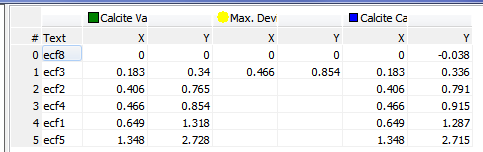
- The table showing all the same X positions
- ValueTable.PNG (8.46 KiB) Viewed 5188 times
But in the graphics the points are at different X values:
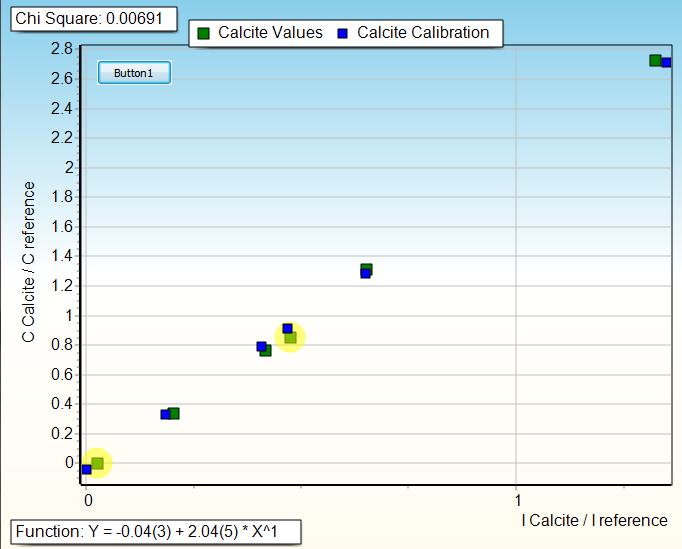
- The graphics showing deviating X positions
- ValueGraphics.PNG (24.7 KiB) Viewed 5190 times
To reproduce this please load the chart from the attached tee file.
best regards,
X-Ray
-
Attachments
-
- TestSeriesXValueBug.zip
- ZIP file containing the .tee file to reproduce the issue
- (1.16 KiB) Downloaded 502 times
-
Yeray
- Site Admin

- Posts: 9534
- Joined: Tue Dec 05, 2006 12:00 am
- Location: Girona, Catalonia
-
Contact:
Post
by Yeray » Fri Jul 15, 2016 8:02 am
Hello,
After loading your tee file I see the first 2 series are assigned to the top axis while the third series is assigned to the bottom axis. By default, each axis automatically scales to fit the points in the series assigned to it; but they also add some offset internally to avoid overlapping when possible.
In your case, if you are not going to show the top axis, you can assign all the series to the bottom axis:
Code: Select all
  Chart1[0].HorizAxis:=aBottomAxis;
  Chart1[1].HorizAxis:=aBottomAxis;

  Chart1.Axes.Bottom.LabelStyle:=talValue;
-
X-ray
- Newbie
- Posts: 8
- Joined: Mon Jan 25, 2016 12:00 am
Post
by X-ray » Fri Jul 15, 2016 11:28 am
Hello Yeray,
Thank you very much for clearing the confusion !
I assigned the other series to the invisible top axis to not show the markers on the bottom axes, but rather the values.
The call:
Chart1.Axes.Bottom.LabelStyle:=talValue;
is of course the right measure to achieve this.
best regards,
X-ray


