Page 1 of 1
Tchart ColorGrid resolution
Posted: Wed Sep 28, 2016 4:50 pm
by 9235567
Dear Personal support Steema
I wonder if with TChart component is possible to obtain the same color quality and resolution with colorgrid component relative to competing component TMS Software.
try to interpolate the data in the chart ,smoothing and yet the resolution does not improve, I would like to know if you have a better way to make this graph, based on the experience of you
using: teechartt pro 7:05 for Delphi 7
is attached example
greetings
Dynamed ind. with. ltda
Re: Tchart ColorGrid resolution
Posted: Thu Sep 29, 2016 7:11 am
by yeray
Hello,
Could you please arrange a simple example project we can run as-is to see how are you exactly setting and populating your chart and series?
Re: Tchart ColorGrid resolution
Posted: Thu Sep 29, 2016 12:44 pm
by 9235567
Good morning Sr. Yeray
thanks So much by replay
in attachment be project , remember compiled in delphi 7 and teechart 7.05
the project is a software witch capture data from device and plot this data on colorgrid chart
as spoken before the chart losses quality on cologrid chart and we need something near the competitor (TMS)
More one time thanks, best regards.
Dynamed
Re: Tchart ColorGrid resolution
Posted: Tue Oct 04, 2016 2:20 pm
by yeray
Hello,
This is how the application you attached looks when using the current TeeChart version:
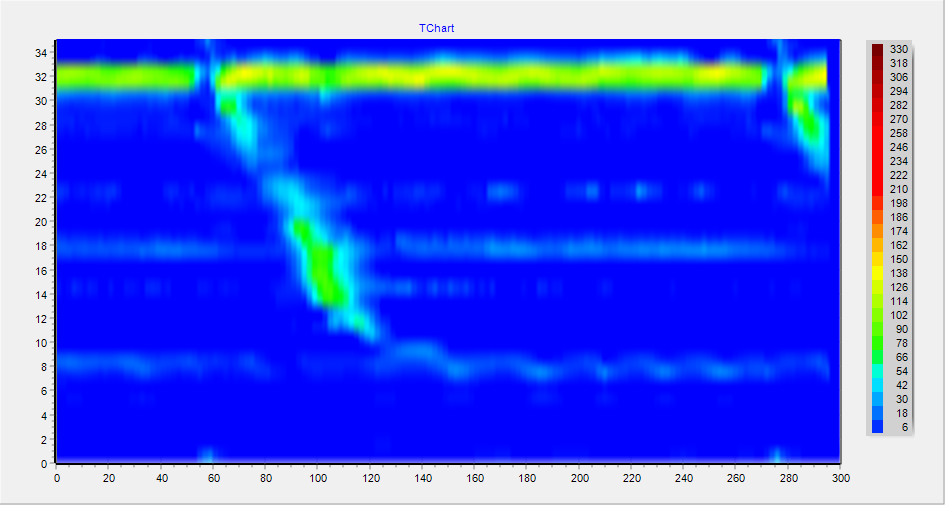
- Project1_2016-10-04_16-18-05.png (228.97 KiB) Viewed 19484 times
That is pretty similar to what you get with TeeChart 7, isn't it?
Re: Tchart ColorGrid resolution
Posted: Tue Oct 04, 2016 3:03 pm
by 9235567
Good afternoon Sr. Yeray
thanks So much by replay
Yes, but i would like that was similar or equal the above and improve the quality and appearance of the graph. The same of first graph using Delphi 7 and Teechart 7.05.
More one time thanks, best regards.
Dynamed
Re: Tchart ColorGrid resolution
Posted: Wed Oct 05, 2016 6:52 am
by yeray
Hello Dynamed,
If I set SGrid.SmoothBitmap to false in your example, the ColorGrid looks like this:
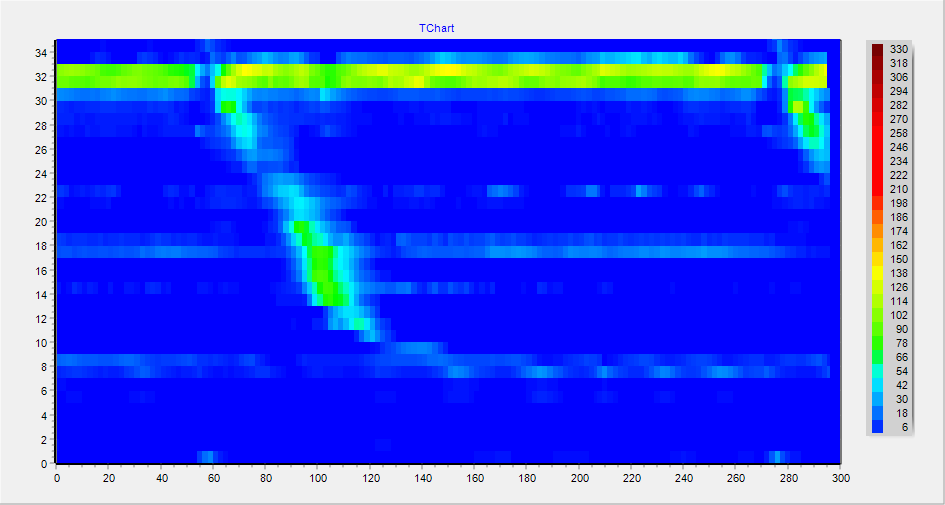
- Project1_2016-10-05_08-36-28.png (45.01 KiB) Viewed 19439 times
If I'm not wrong this resultant grid of 300x36 cells accurately represents your data.
An interpolation to reduce the size of the grid, calculating means, could make sense, but you are asking for the contrary.
Calculating new interpolation points between values would result in (1) fake values and (2) the same resultant grid, just with more resolution.
Is this what you would like to achieve?
Instead of doing this, SmoothBitmap feature in TeeChart's ColorGrid calls GDIPlus doing a "bicubic interpolation" of the pixels to smooth them.
Re: Tchart ColorGrid resolution
Posted: Mon Oct 24, 2016 5:34 pm
by 9235567
Sr. Yeray
thanks So much by replay
So, I tried do modifications in my graphic, but i don´t get what i wanted.
Now, I will change my chart to Countour filed, but in realtime the colorGrid plot is more speeder than contour filed plot, do you know why?
For example, before I was using GridColor and the time of plot is good, but the quality ins't
I did one example using Countour filed and I can saw that the quality is very good, but the time to plot isn't.
Obs: In version 7.05 don't have option countour filed we have upgrade the version 7.05 to 15.
Now I was using Teechart 15 on delphi 7.
More one time thanks, best regards.
Dynamed
Re: Tchart ColorGrid resolution
Posted: Thu Oct 27, 2016 2:28 pm
by yeray
Hello Dynamed,
If I change your TColorGrid series for a TContourSeries I get this:
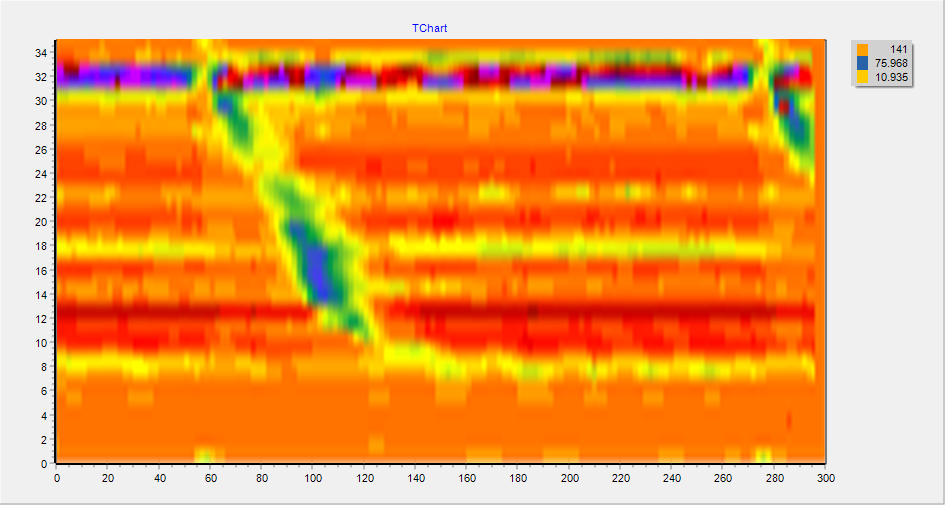
- ColorGrid.png (360.66 KiB) Viewed 19360 times
I'm not sure if this is what you are looking for.
Re: Tchart ColorGrid resolution
Posted: Thu Oct 27, 2016 5:22 pm
by 9235567
hi sr.Yeray
thanks so much by answer
unfortunately not yet what we looking for, but we found out one possible solution
if we use iso-Surface the result be near at we looking for, but the graphics plotting
too slowing as in realtime as in viewer by file same example attchament.
we would like what the response of plotting series Iso-Surface to be like same colorgrid Series
or another tchart series.
this is possible? if yes how we will do that !
thanks so much
best regards
Dynamed
Re: Tchart ColorGrid resolution
Posted: Mon Oct 31, 2016 12:30 pm
by yeray
Hello,
I've simplified your example to compare the performance of the 3 series types: TSurfaceSeries, TContourSeries and TColorGrid:
The IsoSurface seems to be faster than the TContourSeries for me.
The TColorgrid is the fastest of the 3, but it doesn't give the interpolated result you wish.
Re: Tchart ColorGrid resolution
Posted: Tue Nov 15, 2016 6:48 pm
by 9235567
Hello Sr. Yeray
thanks by answer, again
We made your solution, but as I had tested before, it is still very slow to plot the graph, just like the cologrid we have a quick plot
A thing that we observe that if we test the same code in version 8 of the teechart the plotting of the iso-surface the plotting is very similar to that of the colorgrid, that is a possible solution. What we ask is
Is it possible to plot at the same speed as version 8 using the 2016 version?
If so, how can we do this?
If not, is it possible to downgrade from version 2016 to version 8?
Since we do not have version 8, (to be able to do the test in version 8 we had to take the code to a colleague who had version 8 ).
thanks so much
best regards
Dynamed
Re: Tchart ColorGrid resolution
Posted: Thu Nov 17, 2016 1:01 pm
by yeray
Hello,
I see the drawing performance of the TIsoSurfaceSeries got worse since v2014.10.
I've seen this was already identified in the ticket
#1438.
Dynamed wrote:Since we do not have version 8, (to be able to do the test in version 8 we had to take the code to a colleague who had version 8 ).
You could take versions older than v2014.10 login in the client area and navigating to the "Release archive" tab.
Re: Tchart ColorGrid resolution
Posted: Fri Nov 18, 2016 1:35 pm
by 9235567
Hello Sr. Yeray
thanks by answer, again
I did downgrade of teechart 2016 to teechart 2010 and i did one test to saw if i could plot chart better.
When I plot in chart and just make analisys it's reasonable, but when i need make a exam in collect after any seconds more and less 5 seconds
the plot is slow and almost stopping. When i did test with colorgrid this not happen, but can't use colorgrid because need isolines of grid,
there are the component or function in tchart like colorgrid with isolines?
I need that in collect be more faster! Do you know how can i do for this problem?
thanks so much
best regards
Dynamed
Re: Tchart ColorGrid resolution
Posted: Mon Nov 21, 2016 3:59 pm
by yeray
Hello,
Dynamed wrote:there are the component or function in tchart like colorgrid with isolines?
As you'll understand, the calculations performed to draw the levels in the TIsoSurfaceSeries need some time to be done, and improving the TIsoSurfaceSeries performance is the goal of the ticket
#1438.