TeeChart VCL for Borland/CodeGear/Embarcadero RAD Studio, Delphi and C++ Builder.
-
Eic
- Newbie

- Posts: 18
- Joined: Mon Apr 18, 2016 12:00 am
Post
by Eic » Tue Dec 13, 2016 4:05 pm
Hello.
I use the following code to generate donuts. I have little room to generate my graph.
Code: Select all
	TChart * Chart1 = new TChart(this);
	Chart1->Parent = this;
	Chart1->View3D = false;

	Chart1->Width = 270;
	Chart1->Height = 245;

	TDonutSeries* serie = new TDonutSeries(Chart1);
	serie->CustomXRadius = 47;
	serie->CustomYRadius = serie->CustomXRadius;
	serie->Legend->Visible = false;

	serie->Add(82, UnicodeString("Protection \r\n sociale \r\n 82%"), clBlue);
	serie->Add(1, UnicodeString("Avantages en \r\n nature \r\n 1%"), clRed);
	serie->Add(17, UnicodeString("Revenu \r\n immédiat \r\n 17%"), clWhite);

	Chart1->AddSeries(serie);
One of the marks is not positioning correctly. She leaves the panel, while she might be positioned elsewhere. I suspect that the positioning algorithm may not be easy to manage, but maybe you can improve it.
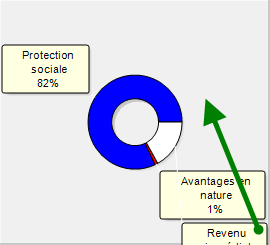
- Graph.png (10.79 KiB) Viewed 8224 times
-
Yeray
- Site Admin

- Posts: 9534
- Joined: Tue Dec 05, 2006 12:00 am
- Location: Girona, Catalonia
-
Contact:
Post
by Yeray » Wed Dec 14, 2016 7:53 am
Hello,
Indeed the antiovelap algorithm could be improved to better handle some situations. However the more complex the alrogirthm, slower it will be.
Have you tried using the TDragMarksTool to manually position your marks?
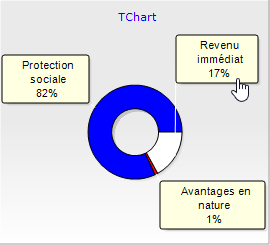
- Project3_2016-12-14_08-50-44.png (9.09 KiB) Viewed 8214 times
(I'm not sure why some programs show the
blue in that screenshot as
purple 
)
-
Eic
- Newbie
- Posts: 18
- Joined: Mon Apr 18, 2016 12:00 am
Post
by Eic » Wed Dec 14, 2016 8:29 am
Hello,
Thank you for your reply.
Your solution is interesting, but alas in our situation, the graphics are not visualized. They are generated, exported as an image and integrated into a document.
Using the TDragMarksTool is not possible.
-
Yeray
- Site Admin
- Posts: 9534
- Joined: Tue Dec 05, 2006 12:00 am
- Location: Girona, Catalonia
-
Contact:
Post
by Yeray » Wed Dec 14, 2016 12:14 pm
Hello,
Here a simple example:
Code: Select all
uses Series, TeeDonut, TeeTools;

procedure TForm1.FormCreate(Sender: TObject);
var tmpRect: TRect;
begin
  Chart1.View3D:=False;
  Chart1.Legend.Visible:=False;
  Chart1.Title.Visible:=False;

  with Chart1.AddSeries(TDonutSeries) as TDonutSeries do
  //with Chart1.AddSeries(TPieSeries) as TPieSeries do
  begin
    Add(82, 'Protection'+sLineBreak+'sociale'+sLineBreak+'82%', clBlue);
    Add(1, 'Avantages en'+sLineBreak+'nature'+sLineBreak+'1%', clRed);
    Add(17, 'Revenu'+sLineBreak+'immédiat'+sLineBreak+'17%', clWhite);
  end;

  Chart1.Tools.Add(TDragMarksTool);

  AntiOverlap;
end;

procedure TForm1.AntiOverlap;
var R1,R2,DummyRect: TRect;
    i, j: Integer;
    mp1, mp2: TSeriesMarkPosition;
begin
  Chart1[0].Marks.Automatic.Move:=false;
  Chart1.Draw;

  mp1:=TSeriesMarkPosition.Create;
  mp2:=TSeriesMarkPosition.Create;

  for i:=0 to Chart1[0].Count-1 do
  begin
    mp1:=Chart1[0].Marks.Positions.Position[i];

    for j:=0 to Chart1[0].Count-1 do
    begin
      if (j<>i) then
      begin
        mp2:=Chart1[0].Marks.Positions.Position[j];

        R1:=mp1.Bounds;
        R2:=mp2.Bounds;

        while (IntersectRect(DummyRect, R1, R2)) do
        begin
          mp1.Custom:=true;
          mp1.LeftTop.x:=mp1.LeftTop.x+4;
          mp1.LeftTop.y:=mp1.LeftTop.y+4;
          mp1.ArrowTo.x:=mp1.LeftTop.x+4;
          mp1.ArrowTo.y:=mp1.LeftTop.y+4;
          R1:=mp1.Bounds;
          R2:=mp2.Bounds;
        end;

        Chart1.Refresh;
      end;
    end;
  end;
end;
It gives a better result, but you could probably improve the algorithm to better fit your needs.
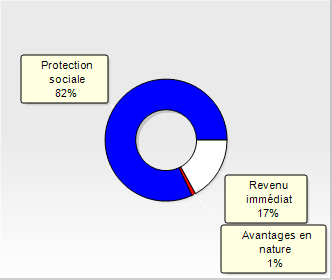
- Project1_2016-12-14_13-12-03.png (9.69 KiB) Viewed 8197 times


