Page 1 of 1
Drawing a line in 3D across a Surface Plot
Posted: Thu Feb 16, 2017 12:10 pm
by 16479009
Hi,
I have been attemptong to draw a line (in 3D) across a surface plot using the MoveTo3D and LineTo3D functions. Intuitively, I tried using the CalcXPOsValue and CalcYPosValue to obtain the start and end positions for x and y but I see not equivalent for the z value. I winder if there is a simpler way to achieve this or whether I am missing something?
Re: Drawing a line in 3D across a Surface Plot
Posted: Fri Feb 17, 2017 9:25 am
by yeray
Hello,
You could use the TSurfaceSeries CalcXPos/CalcYPos/CalcZPos functions. Ie:
Code: Select all
uses TeeSurfa, TeeTools, TeCanvas;

procedure TForm1.FormCreate(Sender: TObject);
begin
  Chart1.Chart3DPercent:=100;
  Chart1.Aspect.Orthogonal:=False;
  Chart1.Aspect.Zoom:=80;
  Chart1.Legend.Visible:=False;

  Chart1.AddSeries(TSurfaceSeries).FillSampleValues(10);

  Chart1.Tools.Add(TRotateTool);
end;

procedure TForm1.Chart1AfterDraw(Sender: TObject);

  function Calc3DPos(ValueIndex: Integer; ASeries: TCustom3DSeries): TPoint3D;
  begin
    with ASeries do
      result:=Point3D(CalcXPos(ValueIndex), CalcYPos(ValueIndex), CalcZPos(ValueIndex));
  end;

begin
  with Chart1.Canvas do
  begin
    Pen.Color:=clRed;
    MoveTo3D(Calc3DPos(2, Chart1[0] as TSurfaceSeries));
    LineTo3D(Calc3DPos(45, Chart1[0] as TSurfaceSeries));
  end;
end;
Re: Drawing a line in 3D across a Surface Plot
Posted: Mon Jul 24, 2017 9:17 am
by 16479009
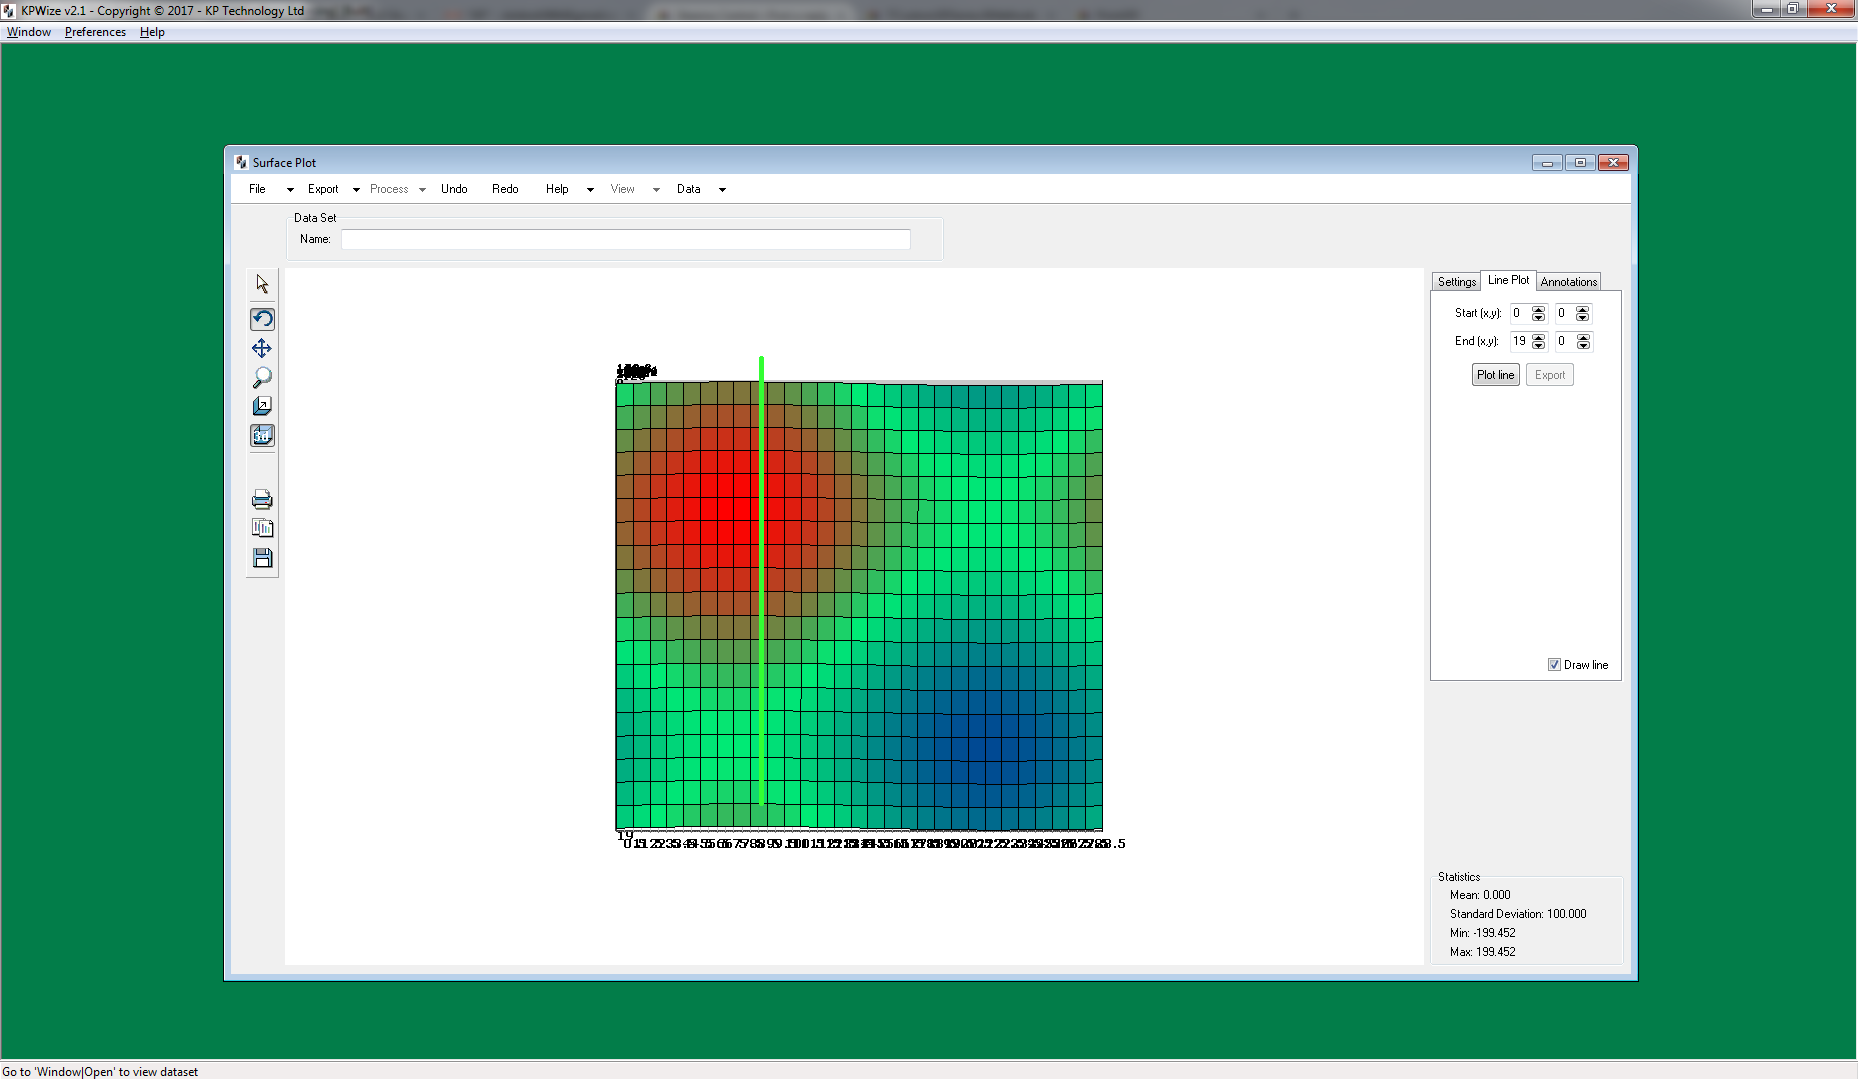
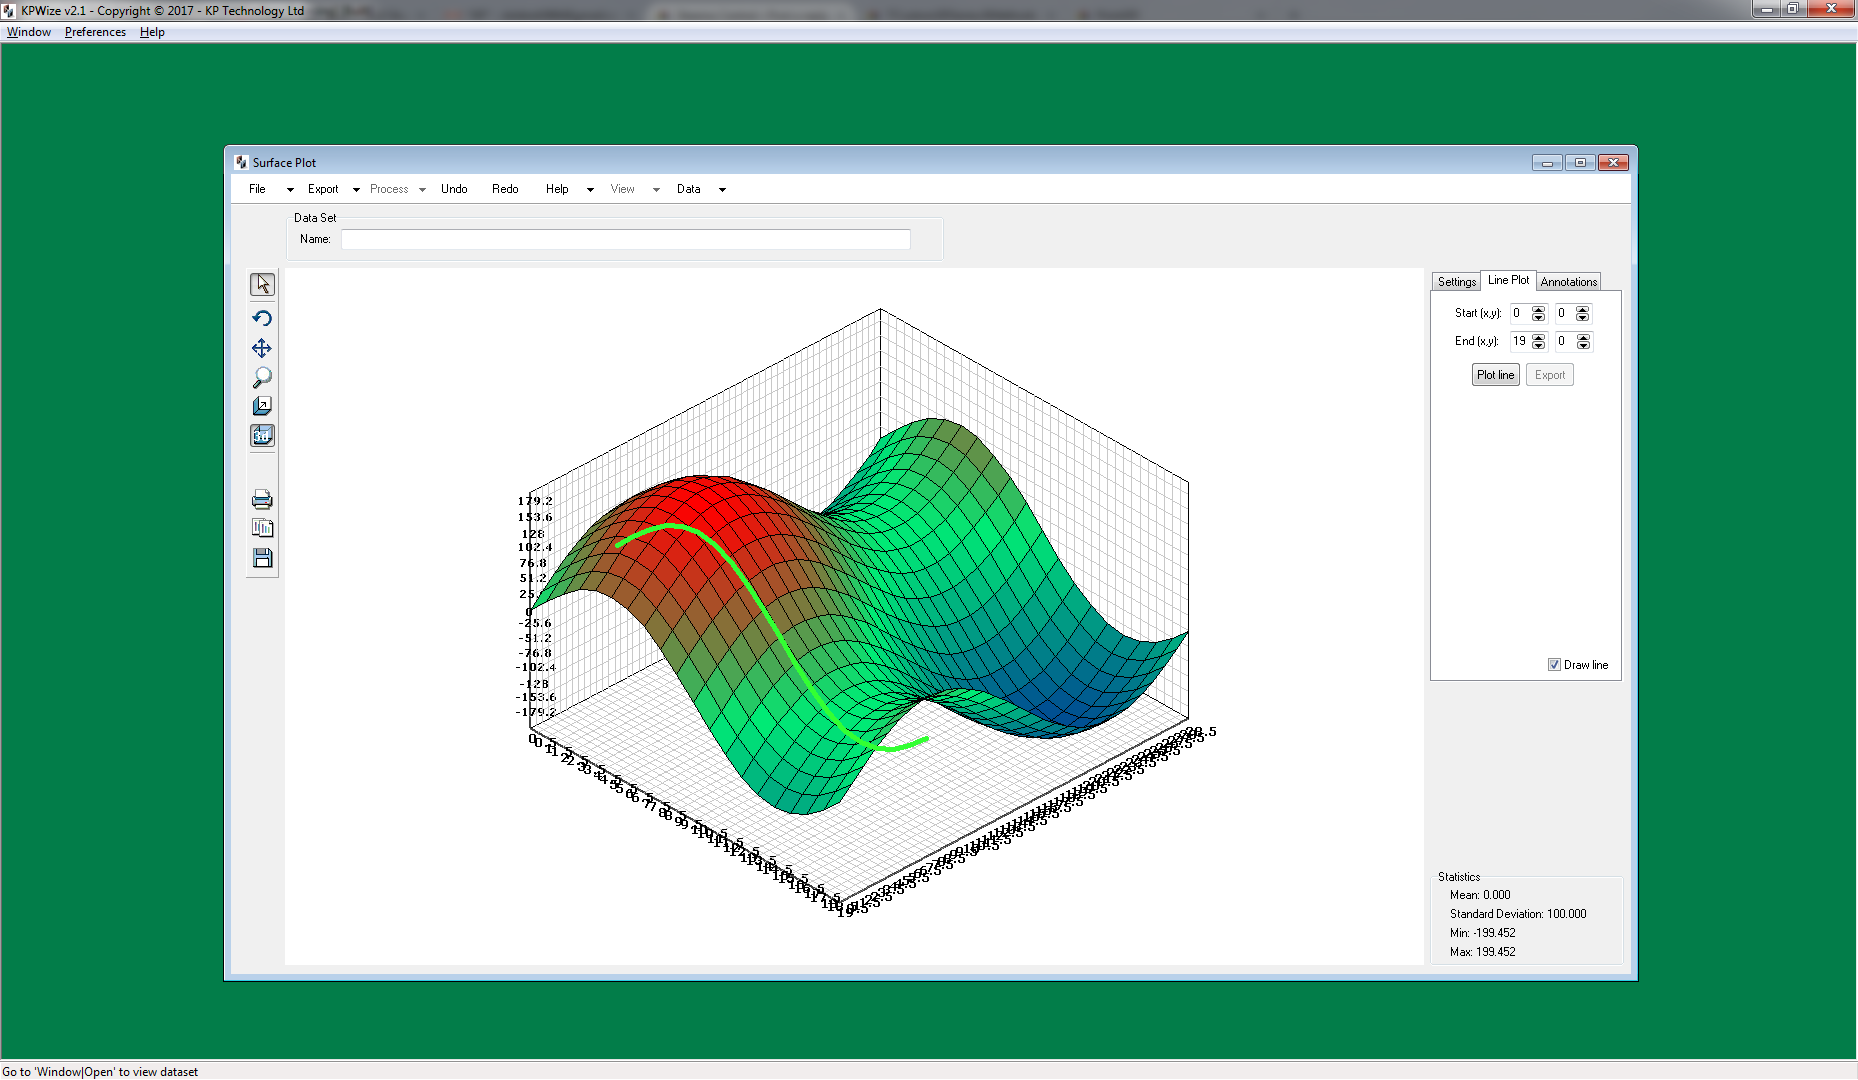
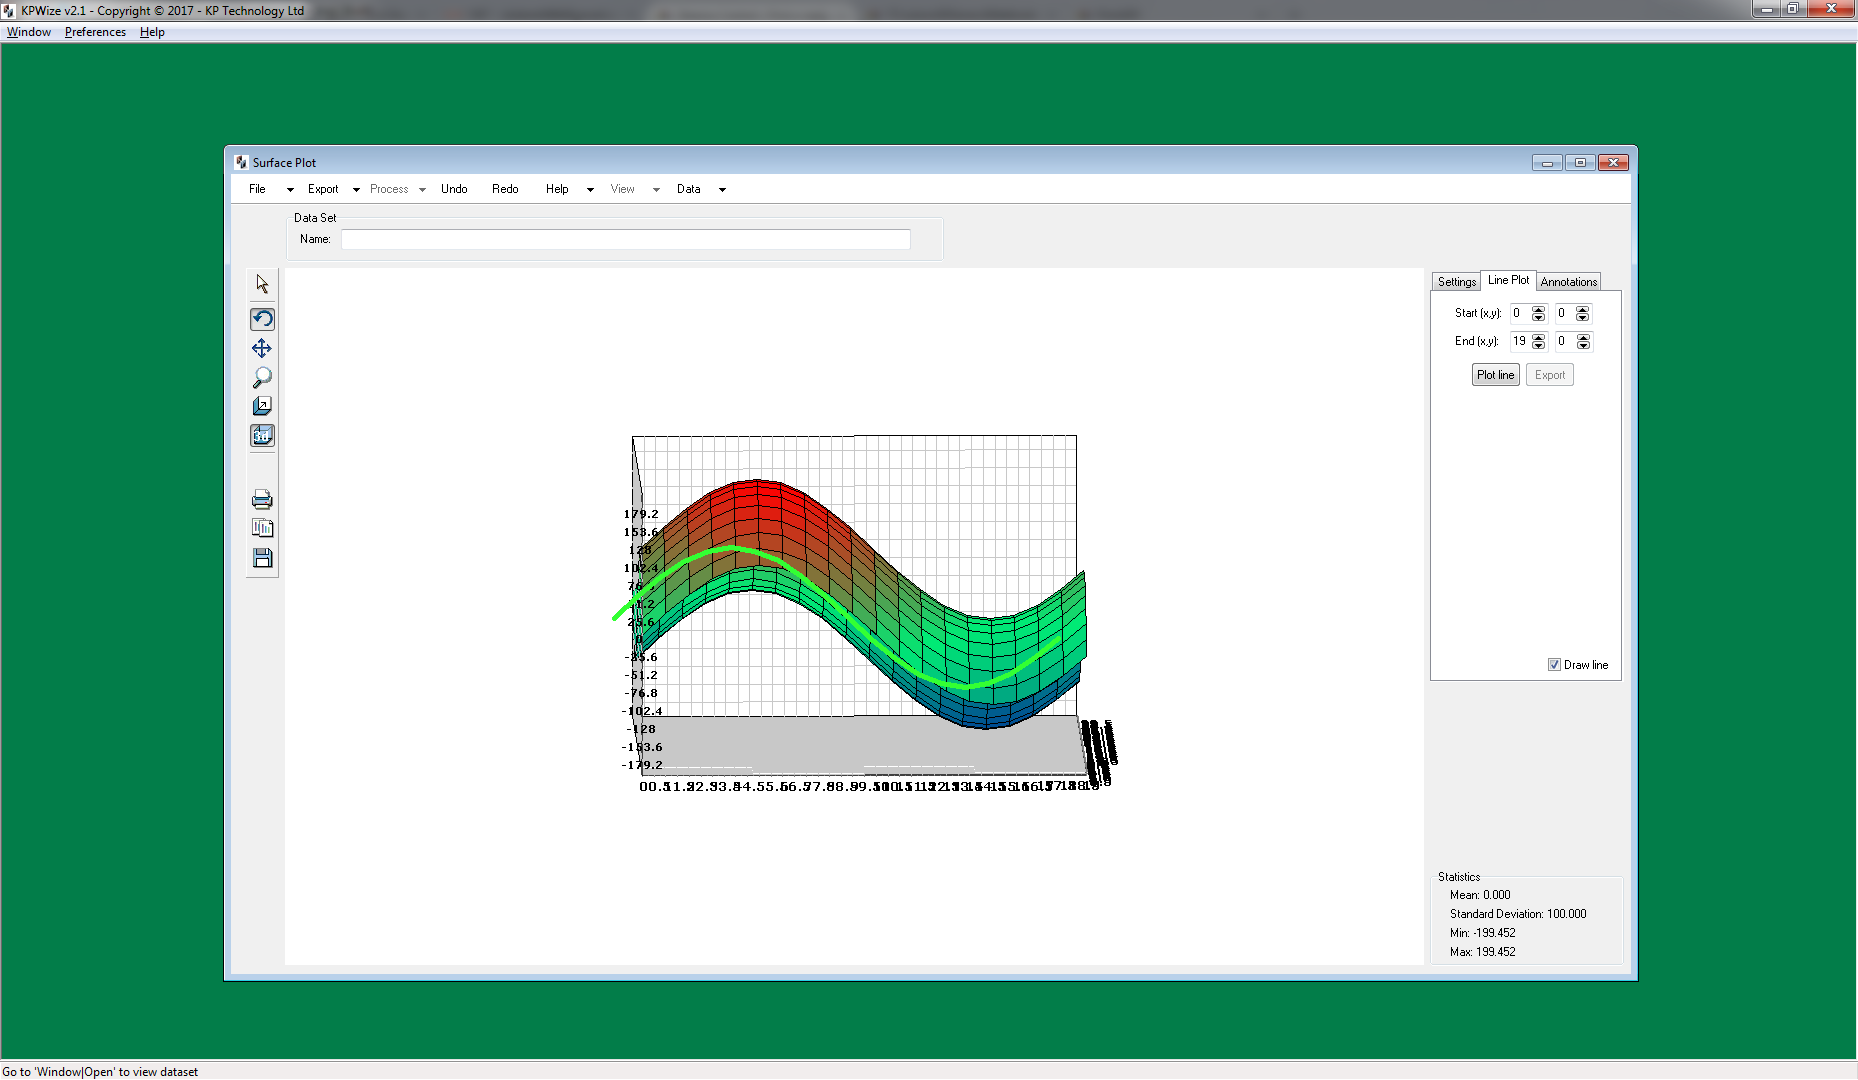
- tmp2.png (107.64 KiB) Viewed 8620 times
- tmp1.png (161.36 KiB) Viewed 8617 times
- tmp3.png (78.46 KiB) Viewed 8619 times
I used this method to draw on the line. I was attempting to use the real values in x, y and z to draw across the chart in each plane. The actual line produced looks perfect but its orientation is wrong. The x and y coordinates appear incorrect in a 3d context. Any advice would be appreciated.
Code: Select all
procedure TKPWSurfaceForm.DrawArbitraryLine;
  function Calc3DPos(valueIndex: Integer): TPoint3D;
  var
    xVal, zVal, yVal: Double;
    xCo, yCo, zCo: Integer;
  begin
    xVal := arbitraryLine.XValue[ValueIndex];
    xCo := Series1.CalcXSizeValue(xVal);
    zVal := arbitraryLine.ZValue[ValueIndex];
    zCo := Series1.CalcPosValue(zVal);
    yVal := arbitraryLine.YValue[ValueIndex];
    yCo := Series1.CalcYPosValue(yVal);

    Memo1.Lines.Add(Format('%d %d %d',[xCo,zCo,yCo]));

    with Series1 do
      Result := Point3D(xCo, zCo, yCo);
  end;
var
  i: Integer;
  pointA, pointB: TPoint3D;
begin
  PopulateArbitraryLine;

  if arbitraryLine.Count > 1 then
    with MainChart.Canvas do
    begin
      Pen.Color := RGB(51,255,51);
      Pen.Width := 5;
      for i := 0 to arbitraryLine.Count-2 do // don't connect the final point to the first
      begin
        Memo1.Lines.Add('From');
        pointA := Calc3DPos(i);
        Memo1.Lines.Add('To');
        pointB := Calc3DPos(i+1);
        MoveTo3D(pointA);
        LineTo3D(pointB);
      end;
    end;
end;
Re: Drawing a line in 3D across a Surface Plot
Posted: Wed Jul 26, 2017 10:04 am
by yeray
Hello,
First of all note in your code I see some issues:
- You are calling CalcXSizeValue that gives the distance in pixels from the given axis value to the axis value 0.
- You are getting the XValue/YValue/ZValue of the given ValueIndex and then converting it to pixels using the CalcPosValue and CalcYPosValue. That's correct but you can just use CalcXPos/CalcYPos/CalcZPos to get the pixel coordinates from a ValueIndex.
- You seem to be creating the Point3D giving the parameters in the wrong order: It expects x, y and z and you are giving x, z and y.
If you only want to highlight a part of your TSurfaceSeries you could just use a TPoint3DSeries. Ie:
Code: Select all
var
  surfaceSeries: TSurfaceSeries;
  arbitraryLine: TPoint3DSeries;

procedure TForm1.FormCreate(Sender: TObject);
var i: Integer;
begin
  Chart1.Chart3DPercent:=100;
  Chart1.Aspect.Zoom:=80;
  Chart1.Aspect.Orthogonal:=False;
  Chart1.Legend.Hide;

  surfaceSeries:=Chart1.AddSeries(TSurfaceSeries) as TSurfaceSeries;
  surfaceSeries.FillSampleValues;

  arbitraryLine:=Chart1.AddSeries(TPoint3DSeries) as TPoint3DSeries;
  arbitraryLine.Pointer.Visible:=False;
  arbitraryLine.Pen.Color:=RGB(51,255,51);
  arbitraryLine.Pen.Width:=5;

  for i:=42 to 47 do
    arbitraryLine.AddXYZ(surfaceSeries.XValue[i], surfaceSeries.YValue[i], surfaceSeries.ZValue[i])
end;
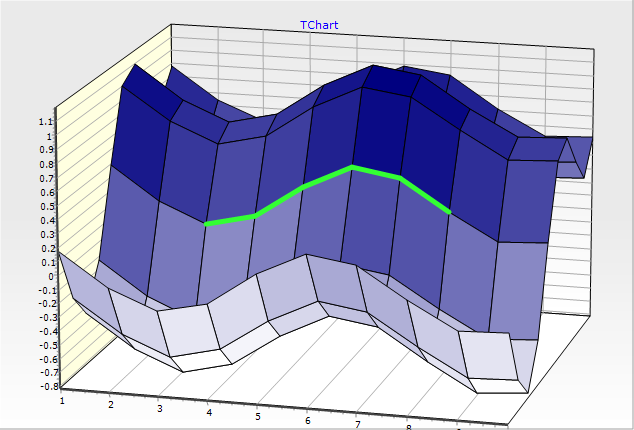
- Project2_2017-07-26_11-46-46.png (66.01 KiB) Viewed 8600 times
If you want to draw a line that isn't following consecutive points of your TSurfaceSeries, then you should draw the line manually as you were doing. Correcting the issues at the top of this post this way will probably work better.
If you still find problems with it, please try to arrange a simple example project we can run as-is to reproduce the situation here.