Page 1 of 2
Chart3DPercent
Posted: Wed Apr 25, 2018 6:12 am
by 16582473
The help file says that Chart3DPercent indicates the size ratio between Chart dimensions and Chart depth. Which dimensions? Changing it does change the depth effect but when, for example, I set it at 50% it does not seem that the depth is half of either the width or the height of the chart.
Jim
Re: Chart3DPercent
Posted: Wed Apr 25, 2018 8:59 am
by yeray
Hello,
It gives a proportional look when you disable the orthogonal property. Here a surface at 50%:
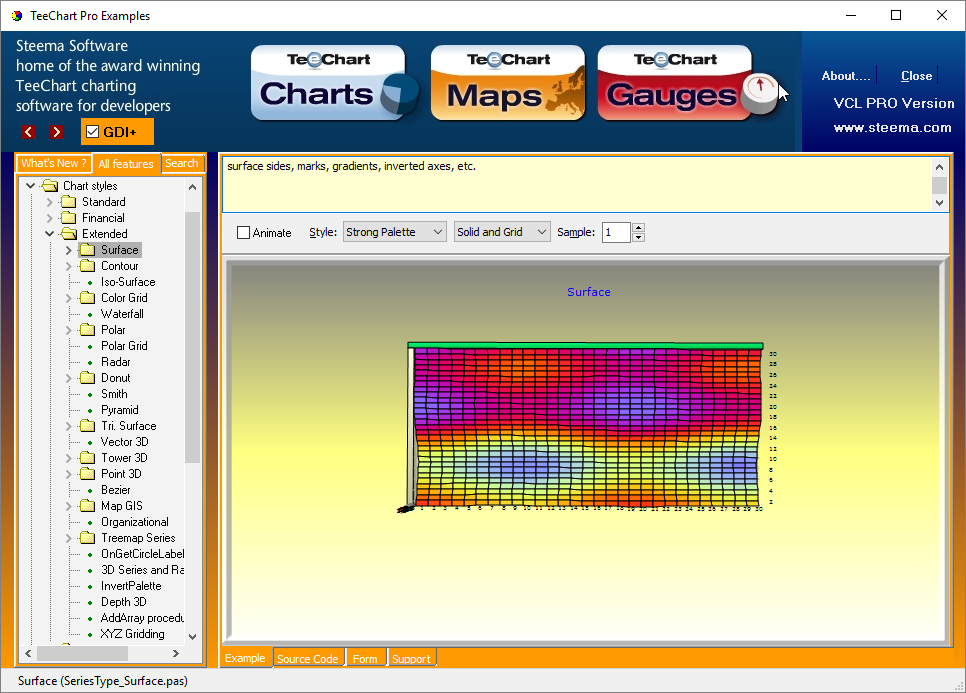
- Tee9new_2018-04-25_10-57-07.png (183.38 KiB) Viewed 28362 times
Re: Chart3DPercent
Posted: Wed Apr 25, 2018 5:32 pm
by 16582473
Thanks, but I would like to know what it is proportional to. I need to be able to exactly control the 3D effect. For scientific charts they have to be geometrically correct - not just look nice. That is true for a mathematical surface where the height of a surface depends on the units for the variables. However my actual application uses 3D points.
Re: Chart3DPercent
Posted: Wed Apr 25, 2018 11:49 pm
by 16582473
The reason I would like to understand the percentage parameter is to see if there is someway i can trick TeeChart into doing a proper isometric 3D plot.
Alternatively, I have just been looking at the code for Calculate3Dposition and Calc3DPoint in the VCLTee.TeCanvas unit. I assume those the procedures used to map 3D points onto the output canvas. I think I will have to modify them.
For a non-orthogonal plot with perspective doing the 3D to 2D projection requires a relatively simple math. Just rotate and then project using homogeneous coordinates to get perspective. I don't entirely understand the code in these procedures.There is a rotation around the Y (vertical) axes, an odd transformation of the Y-coordinate and then a rotation around the Z (depth) axis. Then, an adjustment for perspective (given in terms of a percentage rather than a distance to the viewer). Finally the transformed X and Y coordinates are scaled to pixels.
The code does not seem to include a rotation around the X axis. The CalcTrigValues procedure does include a Tilt parameter to specify such a rotation.
Can I modify a copy of those procedures or do they likely interact with too much other code in TeeChart?
I appreciate any help you can give me. The program I have been working on for the past couple of years is basically done but I cannot release it until it can produce a proper isometric 3D plot pf points.
Thanks,
Jim
Re: Chart3DPercent
Posted: Wed May 02, 2018 8:44 am
by yeray
Hello Jim,
As you've observed, the Calculate3Dposition and Calc3DPoint functions are used to calculate 3D positions into canvas positions.
I've done a simple example using a TPoint3DSeries to try to identify what could be wrong in these functions:
Code: Select all
uses TeePoin3;

procedure TForm1.FormCreate(Sender: TObject);
var i: Integer;
begin
  Chart1.Legend.Hide;
  Chart1.Aspect.Orthogonal:=False;
  Chart1.Aspect.Zoom:=80;
  Chart1.Axes.Depth.Visible:=True;
  Chart1.Axes.Depth.Increment:=1;
  Chart1.Axes.Bottom.Increment:=1;
  Chart1.Axes.Left.Increment:=1;

  Chart1.Chart3DPercent:=100; //50;
  Chart1.Aspect.Rotation:=0; //270;
  Chart1.Aspect.Elevation:=360; //270;

  Chart1.Title.Text.Text:='3DPercent: ' + IntToStr(Chart1.Chart3DPercent) +
                          ', Rotation: ' + IntToStr(Chart1.Aspect.Rotation) +
                          ', Elevation: ' + IntToStr(Chart1.Aspect.Elevation);

  with Chart1.AddSeries(TPoint3DSeries) as TPoint3DSeries do
  begin
    Pointer.Style:=psCircle;
    LinePen.Hide;
    for i:=0 to 9 do
      AddXYZ(i, i, i);
  end;
end;
And I got these screenshots, which seem correct:
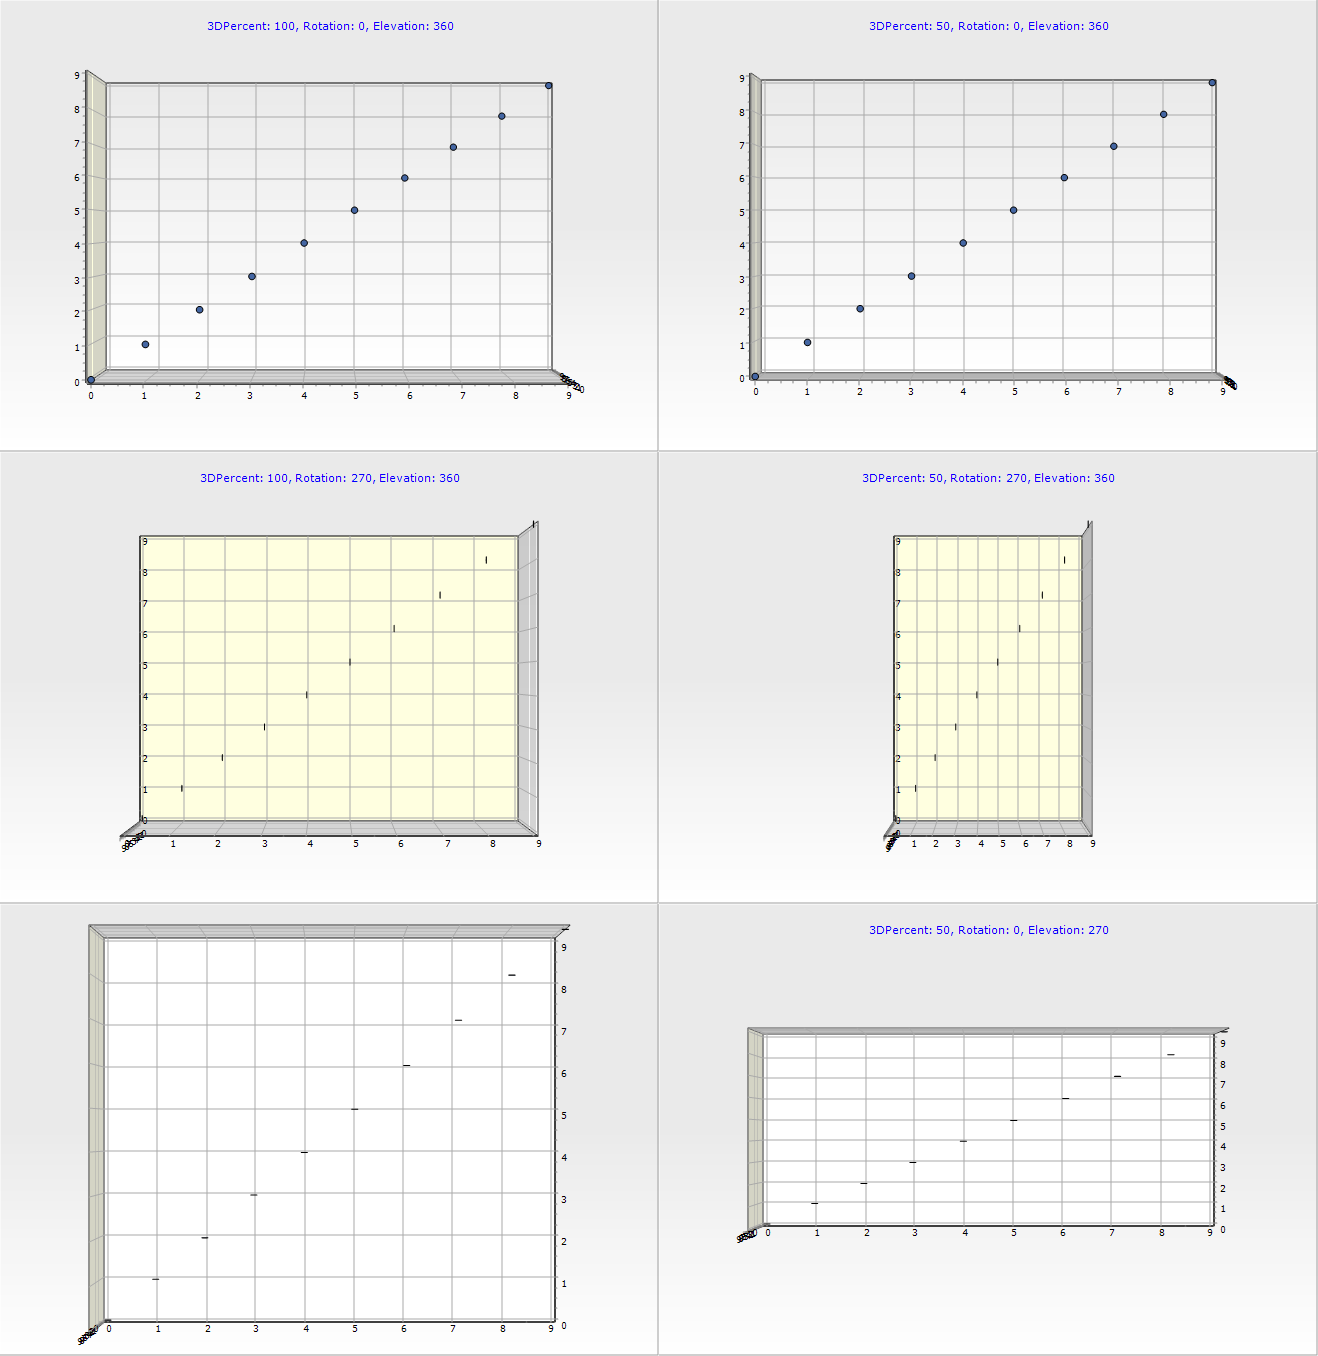
- Project3_2018-05-02_10-30-25.png (87.07 KiB) Viewed 28330 times
Could you please arrange a simple example project we can run as-is to reproduce the problem here?
Re: Chart3DPercent
Posted: Sat May 05, 2018 2:52 am
by 16582473
Well, just any 3D chart example where the lengths of all 3 axes should look to be at the same scale for any rotation. That is, a cube must be seen as a cube for any rotation and a sphere still a sphere. That is, it should give an orthographic view for any rotation. See
https://en.wikipedia.org/wiki/Orthographic_projection.
It should also use perspective properly. The present code cannot be used for a true perspective view because I only see one parameter to control the apparent depth (the percent parameter). For true perspective (see
https://en.wikipedia.org/wiki/3D_projec ... projection) one has to be able to specify the location of the viewer relative to the object being plotted.
I hate to be a pest about this but these two options are essential for many types of scientific plots. I hope at least the orthographic projection could be implemented soon - though then adding perspective is just a simple addition to the projection equations.
Oh, and note also that the code in the Calculate3Dposition and Calc3DPoint functions assume square pixels. visually, probably not so important but it really should be included.
Thanks,
Jim
Re: Chart3DPercent
Posted: Sun May 13, 2018 4:16 pm
by 16582473
Ok, here is a simple program that just draws a unit cube and lets one rotate it using a mouse. Of course it does not look like a cube because I have purposefully made the form too wide initially. I could resize the window to make it look more like a cube but then it will no longer be consistent with a cube if one rotates the plot. I need the plot to always be consistent with a cube for any rotation. If that can be done then I would also like the plot to efficiently fill the form (i.e., filling the form as much as possible while preserving the correct shape).
I thought I might experiment and rewrite some of the code for the Calculate3Dposition procedure (keeping a copy of the original file). I found that I could not as the compiler would complain that the other routines were not compiled with the same version of the compiler. Is there a simple way for me to make and test changes on a copy of the VCLTee.TeCanvas.pas file without disturbing the rest of the TeeChart install? Perhaps make a copy of the whole package under a different name?
Thanks,
Jim
Re: Chart3DPercent
Posted: Mon May 14, 2018 8:16 am
by yeray
Hello,
Aren't you describing the iso axes expected behaviour, as you were discussing
here?
JimR wrote:I thought I might experiment and rewrite some of the code for the Calculate3Dposition procedure (keeping a copy of the original file). I found that I could not as the compiler would complain that the other routines were not compiled with the same version of the compiler. Is there a simple way for me to make and test changes on a copy of the VCLTee.TeCanvas.pas file without disturbing the rest of the TeeChart install? Perhaps make a copy of the whole package under a different name?
Note TeeRecompile.exe utility creates the "VCL" folder, copies the non prefixed units from the "Sources" folder and adds the prefix to them. You can run TeeRecompile.exe from command line with "-generateunits:25" to only do this step without actually compiling anything.
Once you have the "VCL" folder in the "Library" path, you can modify the sources directly from there.
If you are using any other component that uses TeeChart, this integration should be recompiled to avoid errors saying it was compiled with a different version.
If you still find problems with this, don't hesitate to let us know the exact error message you are getting.
Re: Chart3DPercent
Posted: Tue May 15, 2018 12:07 am
by 16582473
Yes, the same problem I commented on previously there and several prior times as the problem is not yet solved. The problem should not be a difficult "challenge" as the projection equations are quite straight-forward. Just need to add another option to use those equations rather that what is presently used in TChart. Using these equations will probably slow the rendering so it should just be an option for those applications that require it.
I also noticed that of the plot using the mouse are constrained. One cannot, for example, rotate the plot so that one can see the underside. Most will not want to do that but some users might. Perhaps another option - or is that already available?
I will try your suggestion of using the TeeRecompile program and see if that works for me.
Thanks,
Jim
Re: Chart3DPercent
Posted: Tue May 15, 2018 4:03 pm
by 16582473
I am trying your suggestion about using the TeeRecompile.exe from command line with "-generateunits:25" (actually I put it in a batch file and it ran with no errors).
Then I added the VCL folder to the library path. I then made a trivial change to VCLTee.TeCanvas.pas (just added a comment). When I then tried to compile I got the message that it was unable to create a backup folder (... VCL/_history). Same error if I just click Save. I then ran DX in administrator mode and I could save changes. However when I tried to compile I got the message in the VCLTee.TeeGDIPlus unit that TeCanvas was not found. I do have the VCL folder in the library search path. It compiled ok before I made the small change to the TeCanvas unit.
I then ran DX in normal mode and was able to compile again if I removed the VCL folder from the library path.
I was able to make some changes to the TeCanvas.pas file in the source folder using other software, save, run TeeRecompile, and then load DX to test my main unit. This will work ok except that it is slow having to exit DX, make changes, run TeeRecompile, then load DX to compile and run my main unit. It also means that I cannot use breakpoints and check values as I step through my changes to the TeCanvas unit.
Must need some other combination of configuration options.
Jim
Re: Chart3DPercent
Posted: Thu May 17, 2018 7:24 am
by yeray
JimR wrote:I am trying your suggestion about using the TeeRecompile.exe from command line with "-generateunits:25" (actually I put it in a batch file and it ran with no errors).
Then I added the VCL folder to the library path. I then made a trivial change to VCLTee.TeCanvas.pas (just added a comment). When I then tried to compile I got the message that it was unable to create a backup folder (... VCL/_history). Same error if I just click Save. I then ran DX in administrator mode and I could save changes. However when I tried to compile I got the message in the VCLTee.TeeGDIPlus unit that TeCanvas was not found. I do have the VCL folder in the library search path. It compiled ok before I made the small change to the TeCanvas unit.
At this point, you should be able to use and modify the sources from the VCL folder. Do you have the "VCLTee" prefix in the "unit scope names"?
Also note you should remove other TeeChart entries that the regular installation may have added (ie, pointing to the "Lib" folder).
JimR wrote:I then ran DX in normal mode and was able to compile again if I removed the VCL folder from the library path.
I was able to make some changes to the TeCanvas.pas file in the source folder using other software, save, run TeeRecompile, and then load DX to test my main unit. This will work ok except that it is slow having to exit DX, make changes, run TeeRecompile, then load DX to compile and run my main unit. It also means that I cannot use breakpoints and check values as I step through my changes to the TeCanvas unit.
Yeah, that's quite annoying, but we haven't found a better way to keep unscoped (<XE2) and scoped units (>=XE2) in sync.
To debug in new IDEs we do this:
- Generate the prefixed units from the Sources folder running "TeeRecompile -generateunits:25".
- Optional: Initialize a temporal git repo in the VCL (or FMX) folder and commit everything. This helps to keep track of the changes when modifying several units.
- Clean the Library path from previous references and add the VCL (or FMX) folder.
- Make sure the "VCLTee" prefix is present in the "unit scope names".
- Develop
- Move the changes back to the non prefixed versions of the modified units when we are happy with them.
Re: Chart3DPercent
Posted: Fri May 18, 2018 3:00 am
by 16582473
I cannot seem to get that to work. Actually, now I cannot get anything to work!
1. I run TeeRecompile -generateunits:25
2. I open DX and try to compile and I get the error in VCLTee.TeeTools.pas that the unit TeCanvas cannot be found. I seem to need to add VCLTee. in front of that unit name in the uses list in TeeTools. If I do that from within DX then when I save I get the error that it cannot create
C:\Program Files (x86)\Steema Software\Steema TeeChart Pro VCL FMX Source Code 2018.24\Source\VCL\VCLTee.TeeTools.$$$. Access is denied.
Do I need to add the "VCLTee." in front of all the unit names within all of the units? Rather tedious!
I then tried running just TeeRecompile but have the same problems.
Jim
Re: Chart3DPercent
Posted: Fri May 18, 2018 6:28 am
by yeray
Hello,
JimR wrote:Do I need to add the "VCLTee." in front of all the unit names within all of the units? Rather tedious!
No, that's precisely what "generateunits" argument does!
Please make sure the "VCLTee" prefix is present in the "unit scope names" in the project options or the IDE options. I've added it to the list above.
Re: Chart3DPercent
Posted: Fri May 18, 2018 12:56 pm
by 16582473
OK, done. I also did a fresh install so I would be back to a known configuration. It now runs ok but if I make a change to VCLTee.TeCanvas from within the DX editor I get that error msg saying:
C:\Program Files (x86)\Steema Software\Steema TeeChart Pro VCL FMX Source Code 2018.24\Source\VCL\VCLTee.TeeTools.$$$. Access is denied.
It seems that it is a protected directory. The VCL folder was "read only" so I changed that. I also saw that normal users did not have full access to files in that folder so I changed that also. I could then edit and save changes to the VCLTee.TeCanvas unit. However I could not set breakpoints. I could mark them but as soon as I tried to run (F9) they were disabled. Must be one more thing I have to set.
Thanks for all your help!!
Jim
Re: Chart3DPercent
Posted: Sun May 20, 2018 9:08 pm
by 16582473
Curiously, today I can edit that unit and set breakpoints. Not sure what is different in my setup.
I discovered right away that the problem in not in Calc3DPos or even in the calling sequence for that procedure. The arguments to that procedure are already integers in pixel units so the allocation of a certain number of pixels to the X, Y, and Z axes has been made much earlier. I am not yet sure where. Need to adjust that routine to allocate pixels so there are the same number of pixels per unit along the axes. Can just suggest where to look? Somewhere where the view of the 3D space is defined.
Progress!
Jim