Page 1 of 2
Chart possible with Teechart?
Posted: Sun Jul 01, 2018 2:20 pm
by 10551566
Hi, can Teechart be used to create a "chart" like the image below? Basically just a series of squares with different colors and sorted by a specific value. I'm using Teechart 8.
Thanks in advance for any pointers.
Image:

Re: Chart possible with Teechart?
Posted: Mon Jul 02, 2018 7:58 am
by yeray
Hello,
Here a simple example using TBarSeries:
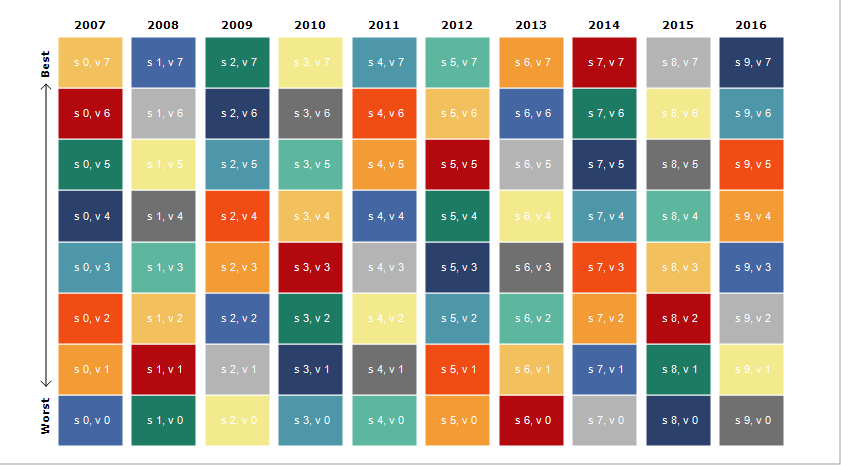
- Chart1.png (32.65 KiB) Viewed 21960 times
Code: Select all
uses Series, TeeTools;

procedure TForm1.Chart1AfterDraw(Sender: TObject);
var tmpX, tmpY0, tmpY1: Integer;
begin
  tmpX:=Chart1.ChartRect.Left+20;
  tmpY0:=Chart1.ChartRect.Top+50;
  tmpY1:=Chart1.ChartRect.Bottom-60;

  with Chart1.Canvas do
  begin
    VertLine3D(tmpX, tmpY0, tmpY1, 0);
    Line(tmpX, tmpY0, tmpX-5, tmpY0+5);
    Line(tmpX, tmpY0, tmpX+5, tmpY0+5);
    Line(tmpX, tmpY1, tmpX-5, tmpY1-5);
    Line(tmpX, tmpY1, tmpX+5, tmpY1-5);
  end;
end;

procedure TForm1.FormCreate(Sender: TObject);
var i, j: Integer;
begin
  Chart1.View3D:=False;
  Chart1.Legend.Hide;
  Chart1.Axes.Top.LabelsFont.Style:=[fsBold];
  Chart1.Gradient.Visible:=False;
  Chart1.Color:=clWhite;
  Chart1.Walls.Hide;
  Chart1.Axes.Top.Grid.Hide;
  Chart1.Axes.Top.MinorTicks.Hide;
  Chart1.Axes.Top.Ticks.Hide;
  Chart1.Axes.Top.Axis.Hide;
  Chart1.Axes.Left.Hide;
  Chart1.Title.Hide;

  Chart1.Axes.Top.Items.Clear;
  for i:=0 to 9 do
  begin
    with Chart1.Axes.Top.Items.Add(i, IntToStr(2007+i)) do
    begin
      Format.Font.Style:=[fsBold];
      Format.Font.Name:='Verdana';
    end;

    with Chart1.AddSeries(TBarSeries) as TBarSeries do
    begin
      HorizAxis:=aTopAxis;
      MultiBar:=mbSelfStack;
      MarksOnBar:=True;
      MarksLocation:=mlCenter;
      Marks.Font.Color:=clWhite;
      Marks.Transparent:=True;
      Pen.Color:=clWhite;
      BarWidthPercent:=100;

      for j:=0 to 7 do
        AddBar(10,'s ' + IntToStr(i) + ', v ' + IntToStr(j), OperaPalette[(i*5+j) mod 12]);
    end;
  end;

  Chart1.Draw;

  with Chart1.Tools.Add(TRectangleTool) as TRectangleTool do
  begin
    Text:='Best';
    Shape.Angle:=90;
    Shape.Transparency:=0;
    Shape.Pen.Hide;
    Shape.AutoSize:=True;
    Shape.Font.Style:=[fsBold];
    Shape.Font.Name:='Verdana';
    AllowDrag:=False;
    AllowResize:=False;
    Left:=Chart1.ChartRect.Left;
    Top:=Chart1.ChartRect.Top+20;
  end;

  with Chart1.Tools.Add(TRectangleTool) as TRectangleTool do
  begin
    Text:='Worst';
    Shape.Angle:=90;
    Shape.Transparency:=0;
    Shape.Pen.Hide;
    Shape.AutoSize:=True;
    Shape.Font.Style:=[fsBold];
    Shape.Font.Name:='Verdana';
    AllowDrag:=False;
    AllowResize:=False;
    Left:=Chart1.ChartRect.Left-5;
    Top:=Chart1.ChartRect.Bottom-40;
  end;
end;
Re: Chart possible with Teechart?
Posted: Mon Jul 02, 2018 8:01 am
by 10551566
Hi, thanks a lot, looks like exactly what I need.
Regards,
Vincenzo
Re: Chart possible with Teechart?
Posted: Mon Jul 02, 2018 11:14 am
by 10551566
Does the sample code work with version 8? (VCL) When I compile it I get a few error messages of functions/fields not defined, e.g.
Chart1.Walls.Hide;
MarksOnBar:=True;
MarksLocation:=mlCenter;
Re: Chart possible with Teechart?
Posted: Mon Jul 02, 2018 12:38 pm
by 10551566
I managed to compile the code by changing .hide to .visible := false (but had to remove MarksOnBar:=True; MarksLocation:=mlCenter;).
The chart I'm getting looks different from the example you provided, could it be because of the code I had to change or because I'm using a different Teechart version?

Re: Chart possible with Teechart?
Posted: Tue Jul 03, 2018 7:20 am
by yeray
Hello,
I see in TeeChart v8 the SelfStack MultiBar option doesn't work fine when using multiple TBarSeries, making this approach unusable in that version.
So I would try with a TPointSeries or a TShapeSeries to draw those squares.
If you still find problems with it, we'd need some extra information to try to prepare some example here.
Should all the squares be shown all the time or you'd allow to zoom (making the squares bigger) or scroll them? In the case of allowing to zoom, would you allow to modify their width/height relation?
Re: Chart possible with Teechart?
Posted: Tue Jul 03, 2018 7:55 am
by 10551566
Hi,
Thanks for the reply. Not really sure how to implement this with TPoint/ShapeSeries hence an example would be appreciated. The squares should grow/shrink depending on the window size (holding the chart) but the dimension should remain proportionate (i.e. remain squares and not become rectangles). One additional "challenge" is that each data point in a series should retain the same color in all series (so that one can identify the position of an item in each series).
Re: Chart possible with Teechart?
Posted: Tue Jul 03, 2018 8:22 am
by 10551566
I forgot to add that the squares should be always shown (no scrolling).
Re: Chart possible with Teechart?
Posted: Tue Jul 03, 2018 9:14 am
by yeray
Hello,
You could create a class to store all the necessary information in a list. Ie:
Code: Select all
  TMyType=(macro, equity, futures, event, debt, conv_arbit, fix_arbit, market);

  TMyShape=class
    MyType: TMyType;
    Year: Integer;
    Value: Double;
    function GetColor: TColor;
    function GetText: String;
    constructor Create(AValue: Double; AYear: Integer; AType: TMyType);
  end;

function TMyShape.GetColor: TColor;
begin
  case MyType of
    macro: result:=$bab300;
    equity: result:=$67635e;
    futures: result:=$1e92f7;
    event: result:=$41BD81;
    debt: result:=$476800;
    conv_arbit: result:=$9f5105;
    fix_arbit: result:=$12b9fc;
    market: result:=$f1bd16;
  end;
end;

function TMyShape.GetText: String;
begin
  case MyType of
    macro: result:='Global'+sLineBreak+'macro';
    equity: result:='Long/short'+sLineBreak+'equity';
    futures: result:='Managed'+sLineBreak+'futures';
    event: result:='Event'+sLineBreak+'driven';
    debt: result:='Distressed'+sLineBreak+'debt';
    conv_arbit: result:='Convertible'+sLineBreak+'arbitrage';
    fix_arbit: result:='Fixed income'+sLineBreak+'arbitrage';
    market: result:='Equity market'+sLineBreak+'neutral';
  end;

  Result:=Result+sLineBreak+FormatFloat('#,##0.##', Value);
end;

constructor TMyShape.Create(AValue: Double; AYear: Integer; AType: TMyType);
begin
  Value:=AValue;
  Year:=AYear;
  MyType:=AType;
end;
I'm creating a list with all the items but it could be easier with a list for each column. Note I'm adding the data already sorted, so the sorting has still to be implemented. Also note I'm adding the same data from the second column.
Code: Select all
var i: Integer;
    myShapes: TList;
begin
  myShapes:=TList.Create;
  myShapes.Add(TMyShape.Create(-2.74, 2007, market));
  myShapes.Add(TMyShape.Create(3.32, 2007, fix_arbit));
  myShapes.Add(TMyShape.Create(3.37, 2007, conv_arbit));
  myShapes.Add(TMyShape.Create(3.69, 2007, debt));
  myShapes.Add(TMyShape.Create(3.77, 2007, event));
  myShapes.Add(TMyShape.Create(3.79, 2007, futures));
  myShapes.Add(TMyShape.Create(4.89, 2007, equity));
  myShapes.Add(TMyShape.Create(6.07, 2007, macro));

  for i:=0 to 8 do
  begin
    myShapes.Add(TMyShape.Create(-40.32, 2008+i, market));
    myShapes.Add(TMyShape.Create(-31.59, 2008+i, conv_arbit));
    myShapes.Add(TMyShape.Create(-28.82, 2008+i, fix_arbit));
    myShapes.Add(TMyShape.Create(-20.48, 2008+i, debt));
    myShapes.Add(TMyShape.Create(-19.76, 2008+i, equity));
    myShapes.Add(TMyShape.Create(-17.74, 2008+i, event));
    myShapes.Add(TMyShape.Create(-4.62, 2008+i, macro));
    myShapes.Add(TMyShape.Create(18.33, 2008+i, futures));
  end;
And finally the chart:
Code: Select all
var Chart1: TChart;

procedure TForm1.FormCreate(Sender: TObject);
var i: Integer;
begin
  Chart1:=TChart.Create(Self);
  Chart1.Parent:=Self;
  Chart1.Align:=alClient;

  Chart1.View3D:=False;
  Chart1.Legend.Hide;
  Chart1.Axes.Top.LabelsFont.Style:=[fsBold];
  Chart1.Gradient.Visible:=False;
  Chart1.Color:=clWhite;
  Chart1.Walls.Visible:=False;
  Chart1.Axes.Top.Grid.Hide;
  Chart1.Axes.Top.MinorTicks.Hide;
  Chart1.Axes.Top.Ticks.Hide;
  Chart1.Axes.Top.Axis.Hide;
  Chart1.Axes.Left.Visible:=False;
  Chart1.Title.Hide;
  Chart1.AllowZoom:=False;
  Chart1.AllowPanning:=pmNone;


  Chart1.Axes.Top.Items.Clear;
  for i:=2007 to 2016 do
  begin
    with Chart1.Axes.Top.Items.Add(i, IntToStr(i)) do
    begin
      Font.Style:=[fsBold];
      Font.Name:='Verdana';
    end;
  end;

  for i:=0 to myShapes.Count-1 do
    with Chart1.AddSeries(TChartShape) as TChartShape do
    begin
      HorizAxis:=aTopAxis;
      Font.Color:=clWhite;
      Pen.Color:=clWhite;
      Style:=chasRectangle;

      X0:=TMyShape(myShapes.Items[i]).Year-0.5;
      X1:=TMyShape(myShapes.Items[i]).Year+0.5;
      Y0:=MaxValueForYear(TMyShape(myShapes.Items[i]).Year);
      Y1:=Y0+1;
      Color:=TMyShape(myShapes.Items[i]).GetColor;
      Text.Text:=TMyShape(myShapes.Items[i]).GetText;
    end;

  Chart1.OnAfterDraw:=Chart1AfterDraw;
end;

function TForm1.MaxValueForYear(AYear: Integer): Double;
var i: Integer;
begin
  result:=0;

  for i:=0 to Chart1.SeriesCount-1 do
    with Chart1[i] as TChartShape do
      if (AYear > X0) and (AYear < X1) then
         Result:=Result+1;
end;

procedure TForm1.Chart1AfterDraw(Sender: TObject);
var tmpX, tmpY0, tmpY1: Integer;
begin
  tmpX:=Chart1[0].CalcXPos(0) - 10;
  tmpY0:=Chart1.ChartRect.Top+50;
  tmpY1:=Chart1.ChartRect.Bottom-60;

  with Chart1.Canvas do
  begin
    RotateLabel(tmpX-7, tmpY0-10, 'Best', 90);
    RotateLabel(tmpX-7, tmpY1+45, 'Worst', 90);

    VertLine3D(tmpX, tmpY0, tmpY1, 0);
    Line(tmpX, tmpY0, tmpX-5, tmpY0+5);
    Line(tmpX, tmpY0, tmpX+5, tmpY0+5);
    Line(tmpX, tmpY1, tmpX-5, tmpY1-5);
    Line(tmpX, tmpY1, tmpX+5, tmpY1-5);
  end;
end;
This is how it looks with TeeChart v8:
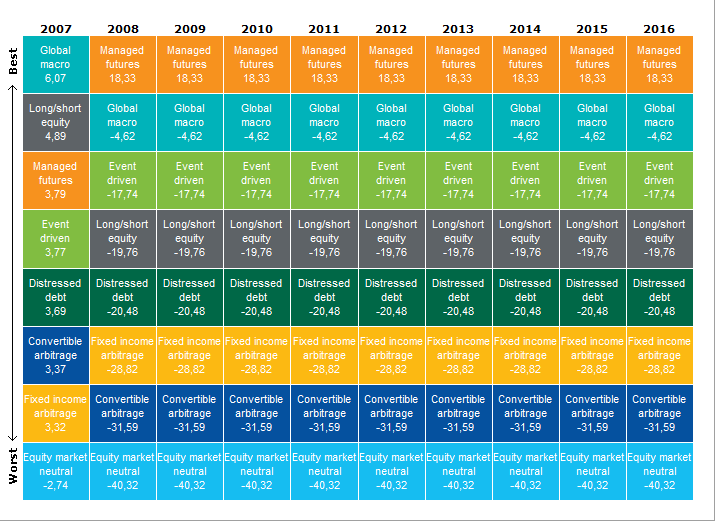
- Project3_2018-07-03_11-20-42.png (24.07 KiB) Viewed 21938 times
However, resizing the Chart also resizes the squares to rectangles. This isn't a trivial feature.
Re: Chart possible with Teechart?
Posted: Tue Jul 03, 2018 9:37 am
by yeray
Yeray wrote:However, resizing the Chart also resizes the squares to rectangles. This isn't a trivial feature.
An option would be to set the scales of the axes at OnResize event, with the MakeIsoAxis. As follows:
Code: Select all
procedure TForm1.ChartResize(Sender: TObject);
begin
  MakeIsoAxis(Chart1.Axes.Left, Chart1.Axes.Top);
end;

procedure TForm1.MakeIsoAxis(Vertical, Horizontal: TChartAxis);
var tmpX,
    tmpY,
    XRange,
    YRange,
    Offset,
    XYScreen,
    XMin,
    XMax,
    YMin,
    YMax : Double;
begin
  with Vertical.ParentChart do
  if (ChartHeight>0) and (ChartWidth>0) then
  begin
    XMin:=Chart1.MinXValue(Horizontal);
    XMax:=Chart1.MaxXValue(Horizontal);
    YMin:=Chart1.MinYValue(Vertical);
    YMax:=Chart1.MaxYValue(Vertical);

    XRange:=XMax-XMin;

    tmpX:=(XRange/ChartWidth);

    {$IFDEF CLX}
    XYScreen:=1024.0/768.0;  //TODO
    {$ELSE}
    XYScreen:=1.0*(GetDeviceCaps(Canvas.Handle,HORZSIZE)/Screen.Width)/
                  (GetDeviceCaps(Canvas.Handle,VERTSIZE)/Screen.Height);
    {$ENDIF}

    YRange:=YMax-YMin;

    tmpY:=(YRange/ChartHeight)*XYScreen;

    if tmpX>tmpY then
    begin
      if tmpY<>0 then
      begin
        Offset:=((YRange*tmpX/tmpY)-YRange)/2.0;
        With Vertical do SetMinMax(YMin-Offset,YMax+Offset);
      end;
    end
    else
    if tmpX<tmpY then
    begin
      if tmpX<>0 then
      begin
        Offset:=((XRange*tmpY/tmpX)-XRange)/2.0;
        With Horizontal do SetMinMax(XMin-Offset,XMax+Offset);
      end;
    end;
  end;
end;
Re: Chart possible with Teechart?
Posted: Tue Jul 03, 2018 10:46 am
by 10551566
Thanks a lot for the example code! (Noted about the sorting and rectangles).
If I upgrade to the latest version would then the original code achieve the same? (Since it looks more compact than than the v8 code).
Re: Chart possible with Teechart?
Posted: Tue Jul 03, 2018 11:45 am
by 10551566
I integrated your example code into my project and it looks good, thanks for all the help!
Vincenzo
Re: Chart possible with Teechart?
Posted: Tue Jul 03, 2018 1:40 pm
by 10551566
Sorry one more question... in determining at which position which square should be drawn it seems to be driven by the following code:
Code: Select all
      X0:=TMyShape(myShapes.Items[i]).Year-0.5;
      X1:=TMyShape(myShapes.Items[i]).Year+0.5;
      Y0:=MaxValueForYear(TMyShape(myShapes.Items[i]).Year);
      Y1:=Y0+1;
Other than years I might show monthly data (e.g. Jan to October), or 3-year periods (2000, 2003, 2006 etc), how would I then need to change the X0/X1 values? (are those coordinates within the chart?)
Re: Chart possible with Teechart?
Posted: Thu Jul 05, 2018 7:22 am
by yeray
Hello,
vinc64 wrote:Other than years I might show monthly data (e.g. Jan to October), or 3-year periods (2000, 2003, 2006 etc), how would I then need to change the X0/X1 values? (are those coordinates within the chart?)
Yes, they are values in the axis scale.
Note the labels in the top axis are directly showing the axis values. I populate the shapes with "X0:=Year-05" and "X1:=Year+0.5" to have those Years in the Top axis.
If you want to show months, you could store them also as integers, populate the shapes with Month-05 and Month+05 and then use the OnGetAxisLabel event to convert those values to month names. Something like this:
Code: Select all
procedure TForm1.Chart1GetAxisLabel(Sender: TChartAxis; Series: TChartSeries;
  ValueIndex: Integer; var LabelText: string);
begin
  if (Sender = Chart1.Axes.Bottom) then
  begin
    ValueIndex:=StrToIntDef(LabelText, -1)+1;
    if ValueIndex>0 then
       LabelText:=LongMonthNames[ValueIndex mod 12];
  end;
end;
Regarding "3-year periods (2000, 2003, 2006 etc)", you could still store the Year and then populate the shapes with "X0:=Year-1.5" and "X1:=Year+1.5".
Re: Chart possible with Teechart?
Posted: Thu Jul 05, 2018 7:48 am
by 10551566
Thanks for the reply, will try it out.