Page 1 of 1
How to display events in stacked bar chart
Posted: Fri Mar 01, 2019 6:00 pm
by 16585021
I have spent a few months thinking about how to display events in a stacked bar chart--and have gone through the "All Features" demo and can't find anything. Let me give some context.
I have a stacked bar chart for retirement years that displays balances from different accounts and/or incomes from different accounts.
Here is an example of with two charts, the top one displaying incomes:

I need to be able to add include two additional items in the chart:
1) The accounts have a specific distribution order (e.g. in the income chart you can see the "Old 401(k)" gets distributed first, followed by "Joe's Tool Shop", etc). If the user changes the distribution order in the middle of retirement, I would like to display this event.
2) I need to show an illustrated "market hit" event--e.g. the market drops 20% at their retirement. I need to show this as part of the chart.
Any suggestions on this? The only idea I have so far is to show an icon on top of the bar of the year it occurs--e.g. a market hit showing "20%" with a down arrow next to it, or a recycle icon above a bar when the order is changed.
Thanks for any input.
Ed Dressel
Re: How to display events in stacked bar chart
Posted: Mon Mar 04, 2019 8:31 am
by yeray
Hello,
This is more a design doubt than a technical one, isn't it? In that case, I may not be the best person to give you a suggestion.

But I guess a small icon on top of the bars would be good. It could be recycle and an arrow-down icons, a danger icon, an exclamation,...
And it may be useful to show an annotation explaining what does it indicate when the user moves the mouse over it. Or you could add it to the legend.
Re: How to display events in stacked bar chart
Posted: Wed Mar 13, 2019 12:08 am
by 16585021
Thank you the response.
yes, that was a design question. Now for the technical questions

: how do I add an icon above specific bars, add hits to the icon (I currently use DevEx' hint tool and like it a lot--if I can continue to use that, I would prefer that), and also add it to the legend (that is a great idea!)?
Re: How to display events in stacked bar chart
Posted: Tue Mar 19, 2019 8:27 am
by yeray
Hello,
An option would be using a TRectangleTool and a TAnnotationTool. Ie:
Code: Select all
uses VCLTee.Series, VCLTee.TeeTools, VCLTee.TeePng;

var hitIcon: TRectangleTool;
    hitExpl: TAnnotationTool;

procedure TForm1.Chart1MouseMove(Sender: TObject; Shift: TShiftState; X,
  Y: Integer);
begin
   hitExpl.Visible:=hitIcon.Clicked(X,Y);
end;

procedure TForm1.FormCreate(Sender: TObject);
var i: Integer;
begin
  Chart1.View3D:=False;

  for i:=0 to 4 do
    with Chart1.AddSeries(TBarSeries) as TBarSeries do
    begin
      FillSampleValues;
      MultiBar:=mbStacked;
      Marks.Visible:=False;
    end;

  hitIcon:=Chart1.Tools.Add(TRectangleTool) as TRectangleTool;
  with hitIcon do
  begin
    Shape.Width:=24;
    Shape.Height:=24;
    Shape.Picture.LoadFromFile('C:\tmp\exclamation_icon.png');
    Shape.Transparency:=0;
    Shape.Pen.Visible:=False;
    AllowDrag:=False;
    AllowResize:=False;
    Cursor:=crDefault;
  end;

  hitExpl:=Chart1.Tools.Add(TAnnotationTool) as TAnnotationTool;
  with hitExpl do
  begin
    Text:='Event explanation';
    Shape.Transparent:=True;
  end;

  Chart1.Draw;

  with hitIcon do
  begin
    Left:=Chart1[0].CalcXPos(3) + (TBarSeries(Chart1[0]).BarWidth div 2) - (Shape.Width div 2);
    Top:=Chart1[Chart1.SeriesCount-1].CalcYPos(3) - Shape.Height - 5;
  end;

  with hitExpl do
  begin
    Visible:=False;
    Left:=hitIcon.Left - (hitExpl.Shape.Width div 2);
    Top:=hitIcon.Top - hitIcon.Height;
  end;
end;
But, if you want to show the icon in the legend you should use an extra series, ie an TImagePointSeries, and then you can use it to draw the icon and text on the chart. Ie:
Code: Select all
uses VCLTee.Series, VCLTee.TeePng, VCLTee.ImaPoint;

var hitIcon: TImagePointSeries;

procedure TForm1.Chart1MouseMove(Sender: TObject; Shift: TShiftState; X,
  Y: Integer);
begin
   hitIcon.Marks.Visible:=hitIcon.Clicked(X,Y)>-1;
end;

procedure TForm1.FormCreate(Sender: TObject);
var i: Integer;
    tmp: Double;
begin
  Chart1.View3D:=False;

  for i:=0 to 4 do
    with Chart1.AddSeries(TBarSeries) as TBarSeries do
    begin
      FillSampleValues;
      MultiBar:=mbStacked;
      Marks.Visible:=False;
    end;

  hitIcon:=Chart1.AddSeries(TImagePointSeries) as TImagePointSeries;
  with hitIcon do
  begin
    Title:='Event explanation';
    Pointer.Size:=24;
    Pointer.Picture.LoadFromFile('C:\tmp\exclamation_icon.png');
    Pointer.InflateMargins:=False;

    tmp:=0;
    for i:=0 to Chart1.SeriesCount-1 do
      if Chart1[i] is TBarSeries then
         tmp:=tmp+Chart1[i].YValue[3];

    Chart1.Draw;

    with Chart1.Axes.Left do
      tmp:=CalcPosPoint(CalcPosValue(tmp) - Pointer.Size);

    AddXY(3, tmp, Title);
    Marks.Transparent:=True;
  end;

  Chart1.Axes.Bottom.LabelStyle:=talValue;
end;
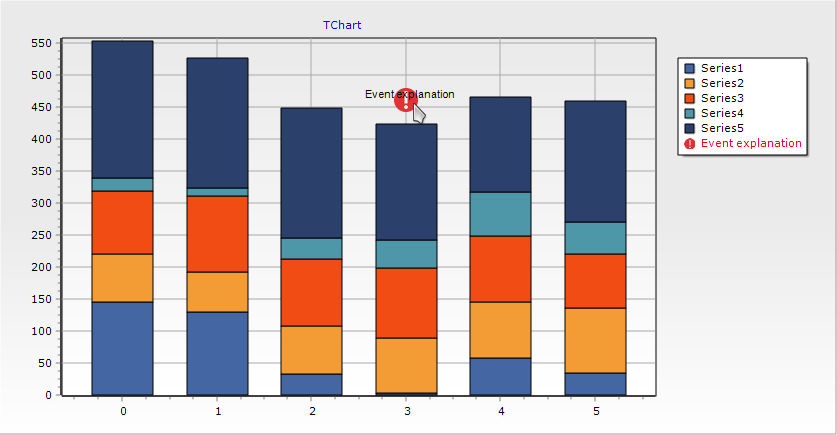
- Project1_2019-03-19_09-27-25.png (20.23 KiB) Viewed 13873 times
Re: How to display events in stacked bar chart
Posted: Mon Apr 01, 2019 5:24 pm
by 16585021
Thank you for this. I played with it a little bit and like the solution--but sometimes the icon is cut off of the chart:

You can reproduce this in the attached demo (simply put the icon on the tallest stack).
Is there a way to fix this? It would be nice if there wasn't unnecessary margin? created.
Thank you,
Ed Dressel
Re: How to display events in stacked bar chart
Posted: Thu Apr 04, 2019 7:49 am
by yeray
Hello,
You can set a MaximumOffset to the left axis, ie after setting the InflateMargins to false (line 117):
Code: Select all
      Pointer.InflateMargins:=False;
      GetVertAxis.MaximumOffset:=Pointer.VertSize;
Re: How to display events in stacked bar chart
Posted: Thu May 30, 2019 6:51 pm
by 16585021
That is pretty slick. I don't understand it but it works.
Thank you