A new ternary graph implementation

TeeChart VCL for Borland/CodeGear/Embarcadero RAD Studio, Delphi and C++ Builder.
Post Reply
Errol
Newbie
Newbie
Posts: 29
Joined: Mon Jul 08, 2019 12:00 am

A new ternary graph implementation

Post by Errol » Fri Nov 15, 2019 12:17 am

As you know, I am quite disappointed with the Ternary Series implementation in TeeChart. A ternary plot is simply an X-Y plot, as there are only 2 independent variables (Z is always equal to 100 - X% - Y% where X% = X/(X+Y+Z)*100 and Y% = Y/(X+Y+Z)*100. This means there is no need to use 3D charting code. In fact, ternary data can be plotted on a simple X-Y chart, but it doesn't look so good and is less easy to understand, so special triangular exes are employed.

I have attached a spreadsheet which shows my thinking. On the first spreadsheet, data is plotted on a simple X-Y plot. The Z-axis is in the direction of the blue arrow, at right-angles to the diagonal edge of the chart. As you can see, the Z-values are correctly located at 80, 60 and 40% respectively, as shown below.
Ternary_XY_Plot.jpg
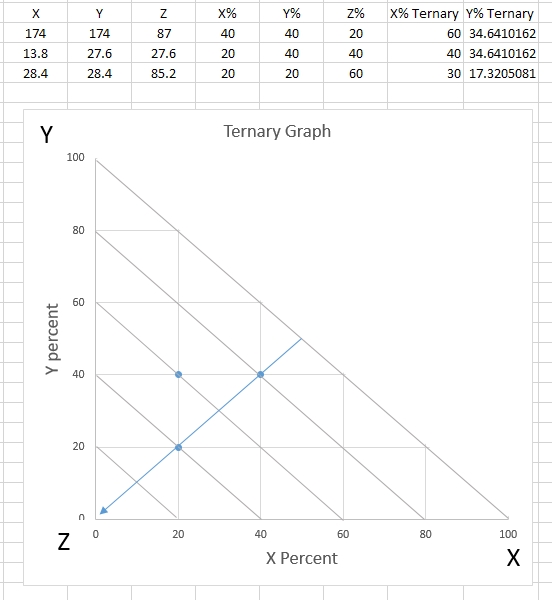
Ternary_XY_Plot.jpg (95.05 KiB) Viewed 10754 times
In the second sheet, I have drawn sloping "axes", and again plotted X-Y data. To do this, the X% and Y% values need to be recalculated using the following formulae:
X% Ternary = X% + Y% * cos(60°)
Y% Ternary = Y% * sin(60°)

Examining the chart, it is clear that the X%, Y% and Z% values are plotted correctly.
Ternary_Triangle.jpg
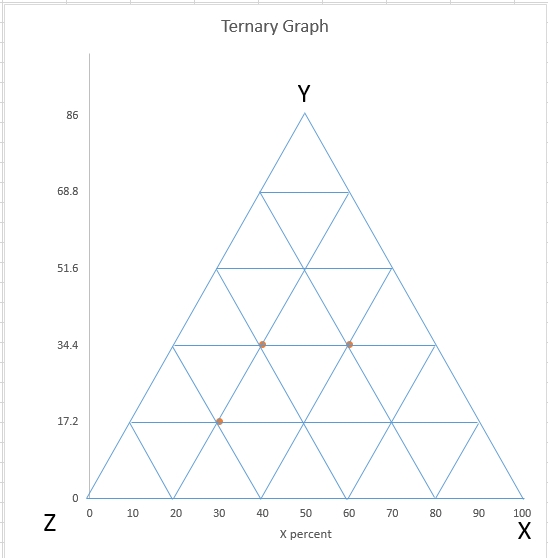
Ternary_Triangle.jpg (69.81 KiB) Viewed 10754 times
Finally, XValues (in Delphi) data should always correspond to the value at the right vertex of the graph, and YValues data to the top vertex of the graph. In the current formulation, XValues corresponds to the top vertex and YValues to the right vertex, apparently following the clockwise rotation of the axes in one configuration. however, the order or rotation of the axes is arbitrary, and the true axis direction for each vertex is a line from the mid-point of the side opposite the vertex to the corresponding vertex. It is just convention to draw the axis on one adjacent side of the triangle or the other. In the third spreadsheet, I have shown three axis configurations commonly in use, an apparent clockwise rotation, and anti-clockwise rotation and where just the x-axis and the y-axis are shown. The data is plotted in exactly the same place for all three configurations. The important aspect is the location of the vertex, so whatever is at the right vertex uses XValues and whatever is at the top axis uses YValues.

The advantage of an implementation like this is that Line Series, Point Series and FastLine Series should be able to be used, just as for a regular XY plot. The implementation should offer the choice of the three axis configurations, and hopefully the chart will be able to be zoomed just like a regular X-Y plot.

Best regards

Errol
Attachments
TernaryPlot_Steema.zip
(22.26 KiB) Downloaded 788 times

Marc
Site Admin
Site Admin
Posts: 1214
Joined: Thu Oct 16, 2003 4:00 am
Location: Girona
Contact:

Re: A new ternary graph implementation

Post by Marc » Tue Nov 26, 2019 3:18 pm

Hello Errol,

Sorry for the delay replying; I'll take a look through the information you've sent.

A note on your comment:

Code: Select all

A ternary plot is simply an X-Y plot, as there are only 2 independent variables (Z is always equal to 100 - X% - Y% where X% = X/(X+Y+Z)*100 and Y% = Y/(X+Y+Z)*100.
We did respond to this requirement, to support x,y input; reference here:
http://bugs.teechart.net/show_bug.cgi?id=2239
(Conversation: https://www.steema.com/support/viewtopi ... =15#p76610)

Bear in mind that the three variable option doesn't assume values as percentages whereas the two variable option does (always summing to 100 with 3rd var).

I'll look in detail at your post but ask if the two x,y variable solution we activated doesn't work for you as intended?
(ok, I've now read your post and see that the goal is to use different series types and enable zoom)

With thanks.
Regards,
Marc
Steema Support

Errol
Newbie
Newbie
Posts: 29
Joined: Mon Jul 08, 2019 12:00 am

Re: A new ternary graph implementation

Post by Errol » Wed Nov 27, 2019 5:15 am

Hello Marc

Thank you for your reply and comments. Perhaps I haven't explained myself clearly enough. I still expect to be able to use three variables, X, Y and Z in a Ternary Chart, but the chart code will automatically convert these to three relative variables using the following formulae:
X% = X/(X + Y + Z)*100
Y% = Y/(X + Y + Z)*100
Z% = Z/(X + Y + Z)*100

Note that there are now only 2 independent variables, as Z% always equals 100 - X% - Y%, so for the actual graphing, only X% and Y% need to be plotted. A ternary plot is really just an X-Y plot but with special triangular axes. If you plot the following values on a regular X-Y chart, they will be located in the correct position within the triangular axis space.
X%" = X% + Y% * cos(60°)
Y%" = Y% * sin(60°)

So, placing a TTernarySeries or a TTernaryPointSeries on a regular chart would do the following:
1. Calculate X% and Y% from X, Y and Z.
2. Plot X%" and Y%".
3. Draw triangular axes (once only), with three options of either clockwise, anticlockwise or X-Y axes.

To draw lines on a ternary chart to demarcate various areas of interest, the user would use just two values, which would correspond to X% and Y%. For instance, to draw a vertical line bisecting the chart into two halves, the line would go from 50,0 to 0,100.

I think this should work, and the user can then easily go from X-Y plots to ternary plots with the same data and same presentation.

Best regards

Errol

Post Reply