Page 1 of 1
Bar Chart self-stacked title vertical position
Posted: Wed Dec 07, 2022 4:36 am
by 16566546
In my previous topic, I was asking about the correct horizontal placement of a title above a self-stacked bar chart. In this post, I would like to be able to set the vertical position of the title just above the top axis of the bar chart, and have it remain there on scroll or zoom operations. As shown in the attached images, the title scrolls off the top of the chart at present if I use CalcBarBounds, or disappear entirely if I zoom the chart.
Any suggestions much appreciated.
Best regards
Errol
Re: Bar Chart self-stacked title vertical position
Posted: Fri Dec 09, 2022 6:17 pm
by yeray
Hello,
Taking the code from the reply I just wrote
there, I've modified it to also calculate the value for the
TAnnotationTool.Top property to position them just above the
ChartRect:
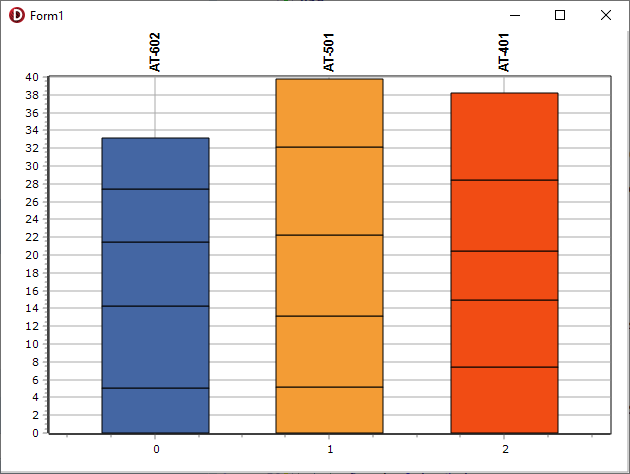
- Project1_2022-12-09_19-17-13.png (15.97 KiB) Viewed 3622 times
Code: Select all
uses Series, TeeTools;

const aWellName: array[0..2] of string = ('AT-602', 'AT-501', 'AT-401');

procedure TForm1.FormCreate(Sender: TObject);
var i, j: Integer;
begin
  Chart1.Title.Hide;
  Chart1.View3D:=False;
  Chart1.Color:=clWhite;
  Chart1.Gradient.Visible:=False;
  Chart1.Walls.Back.Color:=clWhite;
  Chart1.Walls.Back.Gradient.Visible:=False;
  Chart1.Legend.Hide;

  for i:=0 to 2 do
  begin
    with TBarSeries(Chart1.AddSeries(TBarSeries)) do
    begin
      MultiBar:=mbSelfStack;
      Marks.Hide;
      for j:=0 to 4 do
        Add(5+Random*5);
    end;

    with TAnnotationTool(Chart1.Tools.Add(TAnnotationTool)) do
    begin
      Shape.CustomPosition := true;
      Shape.Pen.Color := clWhite;
      Shape.Transparent := true;
      Shape.Font.Size := 10;
      Shape.Font.Style := Shape.Font.Style + [fsBold];
      Shape.Angle := 90;
      Text := aWellName[i];

      OnBeforeDraw:=AnnotationToolBeforeDraw;
    end;
  end;

  Chart1.MarginTop:=10;
  Chart1.Draw;
end;

procedure TForm1.AnnotationToolBeforeDraw(Sender: TObject);
var i: Integer;
begin
  for i:=0 to Chart1.Tools.Count-1 do
    if Sender = Chart1.Tools[i] then
    begin
      PlaceWellNames(i);
      Exit;
    end;
end;

procedure TForm1.PlaceWellNames(AIndex: Integer);
var
  LLeft, LWidth: integer;
  LAcross: integer;
  annot: TAnnotationTool;
  bar: TBarSeries;
begin
  if Chart1.Tools[AIndex] is TAnnotationTool then
  begin
    annot:=TAnnotationTool(Chart1.Tools[AIndex]);
    bar:=TBarSeries(Chart1[AIndex]);

    // centre of bar
    LLeft := bar.CalcXPos(0) + (bar.BarWidth div 2);
    LWidth := annot.Width;   // width of shape
    LAcross := LWidth div 2;   // half title width

    annot.PositionUnits := muPixels;
    annot.Left := LLeft - LAcross;  // this is correct for non-automatic scaling
    annot.Top := Chart1.ChartRect.Top - LAcross - 10;
  end;
end;