Chart shows a dip when including decimals
Posted: Wed Apr 09, 2025 7:38 pm
D12.2, TChart 24.42
In a chart I needed, I could not get a stacked area chart to work, so I add the values of previous series to the new series point. Also, when a value goes to zero, I step it down, so that the chart goes straight to zero.
The chart works fine when I don't use decimal values:
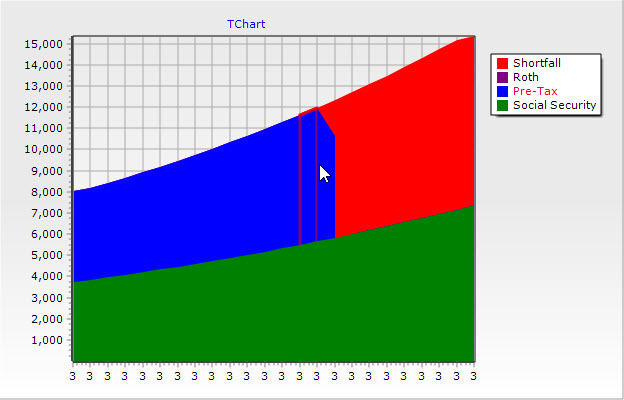
But when I add decimals, it adds a second step down in the 20th year, and appears incorrectly:

The step down code is something I got from Steema years ago (a bit modified).
The attached demo reproduces this--simply check/uncheck the "Include Decimals" checkbox.
How do I avoid the problem with the second chart?
Thank you,
Ed Dressel
In a chart I needed, I could not get a stacked area chart to work, so I add the values of previous series to the new series point. Also, when a value goes to zero, I step it down, so that the chart goes straight to zero.
The chart works fine when I don't use decimal values:
But when I add decimals, it adds a second step down in the 20th year, and appears incorrectly:
The step down code is something I got from Steema years ago (a bit modified).
The attached demo reproduces this--simply check/uncheck the "Include Decimals" checkbox.
How do I avoid the problem with the second chart?
Thank you,
Ed Dressel