Page 1 of 1
Color specific region of chart with different colors
Posted: Fri May 04, 2018 4:12 am
by 9526439
Hi Steema Support,
We are facing one issue regarding fill multiple color in line series. We are using the Dot Net TChart version 2012.
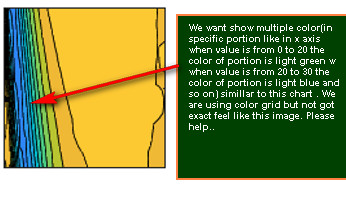
We want to show multiple color(in specific portion like in x axis when value is from 0 to 20 the color of portion is light green when value is from 20 to 30 the color of portion is light blue and so on) similar to below chart .
- Img
- steema.jpg (32.56 KiB) Viewed 17673 times
We are using color grid but not got exact feel like above image.
Thanks in advance.
Thanks and Regards
Planoresearch
Re: Color specific region of chart with different colors
Posted: Fri May 04, 2018 8:36 am
by Christopher
Hello Amol,
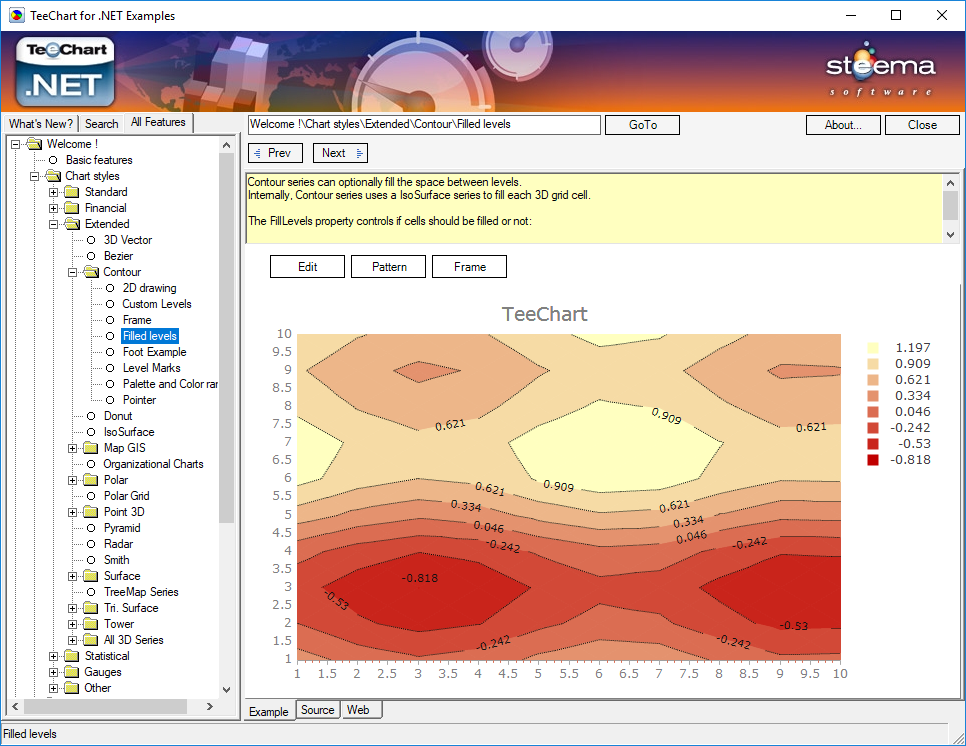
have you had a look at the Contour series? There are several demos in the Feature Demo:
- TeeChartNetExamples_2018-05-04_10-33-56.png (234 KiB) Viewed 17677 times
Re: Color specific region of chart with different colors
Posted: Fri May 04, 2018 9:52 am
by 9526439
Hi Christopher,
Thanks for your quick response.
As you discussed in the earlier mail i have already gone through with it.
But in "Filled Levels" example contrours setting color like this-
this.contour1.Brush.Color = System.Drawing.Color.FromArgb(((int)(((byte)(68)))), ((int)(((byte)(102)))), ((int)(((byte)(163)))));
this.contour1.EndColor = System.Drawing.Color.FromArgb(((int)(((byte)(192)))), ((int)(((byte)(0)))), ((int)(((byte)(0)))));
this.contour1.FillLevels = true;
this.contour1.StartColor = System.Drawing.Color.FromArgb(((int)(((byte)(255)))), ((int)(((byte)(255)))), ((int)(((byte)(192)))));
but actually tchart plot in diffrent way...why?
In start color chart setting light yellow color.
In End color chart setting dark brown color.(I am relating with as we set gradient color).
Query1. But chart showing many colors, i am unable to understand this.
Query2. One more thing sir please explains steps in contour and logic behind drawing of contour means how we draw contour without using fillsamplevalues method.
Query3. Please provide dummy data for drawing contours in teechart.
Thanks in advance.
Regards,
Planoresearch
Re: Color specific region of chart with different colors
Posted: Fri May 04, 2018 10:09 am
by Christopher
Hello Amol,
amol wrote:
Query1. But chart showing many colors, i am unable to understand this.
Okay - the problem is also that I may have misunderstood your requirements.
First question then - is the data you want to represent in your TChart two-dimensional (X,Y) or three-dimensional (X,Y,Z)?
Re: Color specific region of chart with different colors
Posted: Fri May 04, 2018 10:40 am
by 9526439
Hi Christopher,
Yes, We want to draw in two dimensional chart.
Regards,
Planoresearch
Re: Color specific region of chart with different colors
Posted: Fri May 04, 2018 10:47 am
by Christopher
amol wrote:
Yes, We want to draw in two dimensional chart.
Okay, in which case neither the ColorGrid nor the Contour series are relevant, as they are both designed for 3D data (X,Y,Z).
In which case, have you considered the SeriesBand tool?
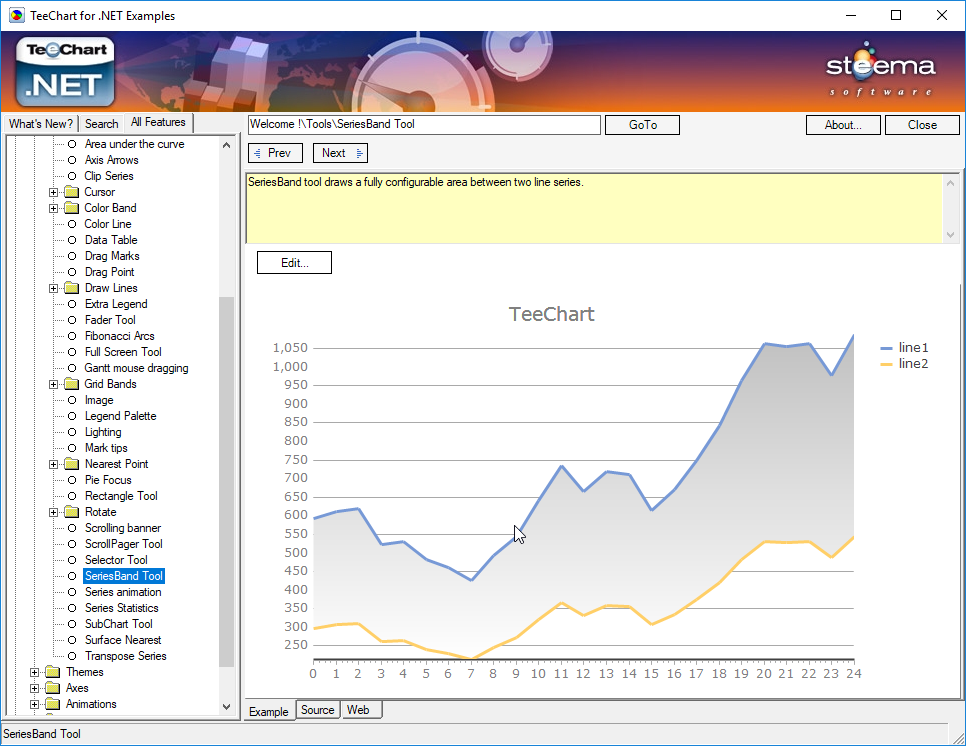
- TeeChartNetExamples_2018-05-04_12-46-10.png (187.38 KiB) Viewed 17661 times
you could add several of these between each of your line series.
Re: Color specific region of chart with different colors
Posted: Fri May 04, 2018 11:00 am
by 9526439
Hi Christopher,
Thanks for very quick response...
Actually we have data for X,Y,Z and want to draw with contour series and the view mode 3D is false.
We can not use line series here.
So please provide solution for below queries-
Query1. But chart showing many colors, i am unable to understand this.
Query2. One more thing sir please explains steps in contour and logic behind drawing of contour means how we draw contour without using fillsamplevalues method.
Query3. Please provide dummy data for drawing contours in teechart.
regards,
Re: Color specific region of chart with different colors
Posted: Mon May 07, 2018 8:01 am
by Christopher
Hello Amol,
Do please bear in mind that the time we have to spend with our clients is not infinite, especially when we receive no or little income for it.
Over and above the ColorGrid/Contour series examples in the Feature Demo, I think the best place to look for further examples of how to use these series is in these forums - could I please suggest you search these forums and have a look at the examples other clients have given us?
e.g. ColorGrid ->
here.
Contour ->
here