How to set the X with category data?

TeeChart for Microsoft Visual Studio .NET, Xamarin Studio (Android, iOS & Forms) & Monodevelop.
coldwind
Newbie
Newbie
Posts: 41
Joined: Tue Dec 27, 2022 12:00 am

How to set the X with category data?

Post by coldwind » Thu Jul 27, 2023 7:22 am

Hi
when i use TeeChart draw the data , I hope when Class value is same then the Y will in vertical line like the picture
hope-result.png
hope-result.png (72.13 KiB) Viewed 14194 times
But when I use string value, I got the error
ERORR.png
ERORR.png (58.5 KiB) Viewed 14194 times
I hope place the X value with difference data like product ID ,the data like:P1,P2,P3, is string array

then teechart show chart with same product ‘s data on vertical line。

my code is

Code: Select all

        public class ProductInfo
        {
            public string Product { get; set; }
            public int Y { get; set; }
        }
        public RawData()
        {
            InitializeComponent();
            
            List<ProductInfo> list = new List<ProductInfo>()
            {
                new ProductInfo() { Product = "P1", Y = 10 },
                new ProductInfo() { Product = "P1", Y = 15 },
                new ProductInfo() { Product = "P1", Y = 6 },
                new ProductInfo() { Product = "P2", Y = 22 },
                new ProductInfo() { Product = "P2", Y = 18 }
            };


            Line line = new Line();
            tChart1.Series.Add(line);
            line.YValues.DataMember = "Y";
            line.XValues.DataMember = "Product";
            line.LabelMember = "Product";
            tChart1[0].Add(list as IList);
        }
the error like teechart can't accpt string data, but i need use string array on X value to Implemente my requirement

Christopher
Guru
Posts: 1603
Joined: Fri Nov 15, 2002 12:00 am

Re: How to set the X with category data?

Post by Christopher » Fri Jul 28, 2023 10:59 am

Hello,

The following code:

Code: Select all

    public partial class Form1 : Form
    {

        public Form1()
        {
            InitializeComponent();

            var line = new Line(tChart1.Chart);

            InitializeChart(line);
        }

        public class ProductInfo
        {
            public string Product { get; set; }
            public int Y { get; set; }
        }

        List<ProductInfo> list = new List<ProductInfo>()
        {
            new ProductInfo() { Product = "P1", Y = 10 },
            new ProductInfo() { Product = "P1", Y = 15 },
            new ProductInfo() { Product = "P1", Y = 6 },
            new ProductInfo() { Product = "P2", Y = 22 },
            new ProductInfo() { Product = "P2", Y = 18 }
        };

        private void InitializeChart(Line line)
        {
            line.YValues.DataMember = "Y";
            //line.XValues.DataMember = "Product";
            line.LabelMember = "Product";
            tChart1[0].Add(list as IList);
        }
    }
gives me the following Chart:
Screenshot from 2023-07-28 12-58-22.png
Screenshot from 2023-07-28 12-58-22.png (28.75 KiB) Viewed 14168 times
Is this Chart what you want? If not, what do you want to see?
Best Regards,
Christopher Ireland / Development & Support
Steema Software
Avinguda Montilivi 33, 17003 Girona, Catalonia
Tel: 34 972 218 797
http://www.steema.com
Instructions - How to post in this forum

coldwind
Newbie
Newbie
Posts: 41
Joined: Tue Dec 27, 2022 12:00 am

Re: How to set the X with category data?

Post by coldwind » Sat Jul 29, 2023 3:28 am

The Chart I want to see is below
chart.png
chart.png (3.91 KiB) Viewed 14151 times

Christopher
Guru
Posts: 1603
Joined: Fri Nov 15, 2002 12:00 am

Re: How to set the X with category data?

Post by Christopher » Mon Jul 31, 2023 8:48 am

Hello,

okay, in which case you can use:

Code: Select all

    public partial class Form1 : Form
    {

        public Form1()
        {
            InitializeComponent();

            var line1 = new Line(tChart1.Chart);
            var line2 = new Line(tChart1.Chart);

            var product1 = "P1";
            var product2 = "P2";

            InitializeChart(line1, product1);
            InitializeChart(line2, product2);

            tChart1.Axes.Bottom.SetMinMax(-1, 2);

            //with more than one series in the chart we need to set the 
            //labels manually like this:
            tChart1.Axes.Bottom.Labels.Items.Add(0, product1);
            tChart1.Axes.Bottom.Labels.Items.Add(1, product2);
        }

        public class ProductInfo
        {
            public string Product { get; set; }
            public int Y { get; set; }
            public int X { get; set; }
        }

        List<ProductInfo> list = new List<ProductInfo>()
        {
            new ProductInfo() { X = 0,  Product = "P1", Y = 10 },
            new ProductInfo() { X = 0, Product = "P1", Y = 15 },
            new ProductInfo() { X = 0, Product = "P1", Y = 6 },
            new ProductInfo() { X = 1, Product = "P2", Y = 22 },
            new ProductInfo() { X = 1, Product = "P2", Y = 18 }
        };

        private void InitializeChart(Line line, string select)
        {
            line.LinePen.Width = 3;
            line.Color = Color.Red;
            line.Pointer.Visible = true;
            line.Pointer.Style = PointerStyles.Circle;
            line.YValues.DataMember = "Y";
            line.XValues.DataMember = "X";
            line.LabelMember = "Product";
            line.Title = select;
            line.Add(list.Where(x => x.Product == select).ToList() as IList);
        }
    }
Screenshot from 2023-07-31 10-47-50.png
Screenshot from 2023-07-31 10-47-50.png (9.87 KiB) Viewed 14100 times
Best Regards,
Christopher Ireland / Development & Support
Steema Software
Avinguda Montilivi 33, 17003 Girona, Catalonia
Tel: 34 972 218 797
http://www.steema.com
Instructions - How to post in this forum

Christopher
Guru
Posts: 1603
Joined: Fri Nov 15, 2002 12:00 am

Re: How to set the X with category data?

Post by Christopher » Mon Jul 31, 2023 2:29 pm

Hello,

if you didn't want to change your ProductInfo class, you could do the data transformation at runtime, e.g.

Code: Select all

 public partial class Form1 : Form
    {

        public Form1()
        {
            InitializeComponent();

            var line1 = new Line(tChart1.Chart);
            var line2 = new Line(tChart1.Chart);

            var product1 = "P1";
            var product2 = "P2";

            InitializeChart(line1, product1);
            InitializeChart(line2, product2);

            tChart1.Axes.Bottom.SetMinMax(GetX(product1) - 1, GetX(product2) + 1);

            //with more than one series in the chart we need to set the 
            //labels manually like this:
            tChart1.Axes.Bottom.Labels.Items.Add(GetX(product1), product1);
            tChart1.Axes.Bottom.Labels.Items.Add(GetX(product2), product2);
        }

        public class ProductInfo
        {
            public string Product { get; set; }
            public int Y { get; set; }
        }

        List<ProductInfo> list = new List<ProductInfo>()
        {
            new ProductInfo() { Product = "P1", Y = 10 },
            new ProductInfo() { Product = "P1", Y = 15 },
            new ProductInfo() { Product = "P1", Y = 6 },
            new ProductInfo() { Product = "P2", Y = 22 },
            new ProductInfo() { Product = "P2", Y = 18 }
        };

        private int GetX(string product)
        {
            var second = product.Substring(1, 1);
            return int.Parse(second);
        }

        private void InitializeChart(Line line, string select)
        {
            line.LinePen.Width = 3;
            line.Color = Color.Red;
            line.Pointer.Visible = true;
            line.Pointer.Style = PointerStyles.Circle;
            line.YValues.DataMember = "Y";
            line.XValues.DataMember = "X";
            line.LabelMember = "Product";
            line.Title = select;
            line.Add(list.Select(x => new { X = GetX(select), x.Product, x.Y }).Where(x => x.Product == select).ToList() as IList);
        }
    }
Best Regards,
Christopher Ireland / Development & Support
Steema Software
Avinguda Montilivi 33, 17003 Girona, Catalonia
Tel: 34 972 218 797
http://www.steema.com
Instructions - How to post in this forum

coldwind
Newbie
Newbie
Posts: 41
Joined: Tue Dec 27, 2022 12:00 am

Re: How to set the X with category data?

Post by coldwind » Thu Aug 17, 2023 1:13 pm

1. Problems with the first picture
Chatrs.png
Chatrs.png (56.85 KiB) Viewed 13719 times
1) As shown in the image above, "Raw Data" Chart is drawn this way, but what about overlapping X-axis headings ?
2) What should I do if the X-axis title overflows?
3) Can the four x axes in the figure above share one? In the figure below, the points can correspond to the X-axis label
four chart share one x label.png
four chart share one x label.png (159.89 KiB) Viewed 13713 times
2. Problems with the second picture
X-axis label is missing.png
X-axis label is missing.png (24.45 KiB) Viewed 13719 times
As shown in the image above,"Raw Data" Chart added double click method, X-axis label is missing, double click method is as follows

Code: Select all

public void chart_DoubleClick(object sender, EventArgs e)
        {
            TChart chart = (TChart)sender;

            using (TChart nChart = DeepClone.DeepCloneCopy(chart))
            using (UIForm dialog = new UIForm())
            {
                nChart.AfterDraw += Chart_AfterDraw; // 处理彩色线的 Label
                dialog.Text = nChart.Axes.Left.Title.Text;
                dialog.WindowState = FormWindowState.Maximized;
                dialog.Controls.Add(nChart);
                nChart.Dock = DockStyle.Fill;
                dialog.ShowDialog();
                dialog.Close();
            }
        }

Marc
Site Admin
Site Admin
Posts: 1217
Joined: Thu Oct 16, 2003 4:00 am
Location: Girona
Contact:

Re: How to set the X with category data?

Post by Marc » Mon Aug 21, 2023 4:24 pm

Hello,

Re. Problem 1.
1) As shown in the image above, "Raw Data" Chart is drawn this way, but what about overlapping X-axis headings ?
2) What should I do if the X-axis title overflows?
How are you adding the data labels? What code. Axis labels normally automatically separate when added, some circumstances override that behaviour. Your code is relevant to understanding the cause of the problem.

Re.
3) Can the four x axes in the figure above share one? In the figure below, the points can correspond to the X-axis label
Yes, see the example here:
https://github.com/Steema/TeeChart-NET- ... iScroll.cs

Regards,
Marc Meumann
Steema Support

coldwind
Newbie
Newbie
Posts: 41
Joined: Tue Dec 27, 2022 12:00 am

Re: How to set the X with category data?

Post by coldwind » Tue Aug 22, 2023 1:34 am

Drawing code is as follows

Code: Select all

    public partial class Form1 : Form
    {

        public Form1()
        {
            InitializeComponent();

            var line1 = new Line(tChart1.Chart);
            var line2 = new Line(tChart1.Chart);

            var product1 = "P1";
            var product2 = "P2";

            InitializeChart(line1, product1);
            InitializeChart(line2, product2);

            tChart1.Axes.Bottom.SetMinMax(-1, 2);

            //with more than one series in the chart we need to set the 
            //labels manually like this:
            tChart1.Axes.Bottom.Labels.Items.Add(0, product1);
            tChart1.Axes.Bottom.Labels.Items.Add(1, product2);
            tChart1.DoubleClick += new EventHandler(this.chart_DoubleClick);
        }

        public class ProductInfo
        {
            public string Product { get; set; }
            public int Y { get; set; }
            public int X { get; set; }
        }

        List<ProductInfo> list = new List<ProductInfo>()
        {
            new ProductInfo() { X = 0,  Product = "P1", Y = 10 },
            new ProductInfo() { X = 0, Product = "P1", Y = 15 },
            new ProductInfo() { X = 0, Product = "P1", Y = 6 },
            new ProductInfo() { X = 1, Product = "P2", Y = 22 },
            new ProductInfo() { X = 1, Product = "P2", Y = 18 }
        };

        private void InitializeChart(Line line, string select)
        {
            line.LinePen.Width = 3;
            line.Color = Color.Red;
            line.Pointer.Visible = true;
            line.Pointer.Style = PointerStyles.Circle;
            line.YValues.DataMember = "Y";
            line.XValues.DataMember = "X";
            line.LabelMember = "Product";
            line.Title = select;
            line.Add(list.Where(x => x.Product == select).ToList() as IList);
        }
    }
This is the drawing
drawChart.png
drawChart.png (9.87 KiB) Viewed 13594 times
Double click event

Code: Select all

public void chart_DoubleClick(object sender, EventArgs e)
        {
            TChart chart = (TChart)sender;

            using (TChart nChart = DeepClone.DeepCloneCopy(chart))
            using (UIForm dialog = new UIForm())
            {
                nChart.AfterDraw += Chart_AfterDraw; // 处理彩色线的 Label
                dialog.Text = nChart.Axes.Left.Title.Text;
                dialog.WindowState = FormWindowState.Maximized;
                dialog.Controls.Add(nChart);
                nChart.Dock = DockStyle.Fill;
                dialog.ShowDialog();
                dialog.Close();
            }
        }
Question:
Double click chart. After deep copy, render the copied chart. The X-axis label is lost.As shown below
copy.png
copy.png (7.74 KiB) Viewed 13594 times
And the bound events are lost. For example:line.GetPointerStyle += Line_GetPointerStyle; nChart.AfterDraw += Chart_AfterDraw;

Marc
Site Admin
Site Admin
Posts: 1217
Joined: Thu Oct 16, 2003 4:00 am
Location: Girona
Contact:

Re: How to set the X with category data?

Post by Marc » Tue Aug 22, 2023 7:01 am

Hello,

Not being sure about the definition of the deepclone or the UIForm dialogue form I used a Chart export and import and standard form. I noticed that the Axis Label Item collection didn't copy properly so I added the copy manually. I put some code in OnAfterDraw and it all seems to work ok:

Code: Select all

private void tChart1_DoubleClick(object sender, EventArgs e)
{
    TChart chart = (TChart)sender;

    MemoryStream ms = new MemoryStream();

    chart.Export.Template.Save(ms);

    using (TChart nChart = new TChart())
    using (Form dialog = new Form())
    {
        ms.Position = 0;
        nChart.Import.Template.Load(ms);

        nChart.Axes.Bottom.Labels.Items.Clear();

        foreach (Steema.TeeChart.AxisLabelItem axItem in tChart1.Axes.Bottom.Labels.Items)
            nChart.Axes.Bottom.Labels.Items.Add(axItem);

        nChart.AfterDraw += tChart1_AfterDraw; // 处理彩色线的 Label
        dialog.Text = nChart.Axes.Left.Title.Text;
        dialog.WindowState = FormWindowState.Maximized;
        dialog.Controls.Add(nChart);
        nChart.Dock = DockStyle.Fill;
        dialog.ShowDialog();
        dialog.Close();
    }
}

private void tChart1_AfterDraw(object sender, Steema.TeeChart.Drawing.Graphics3D g)
{
    ((Steema.TeeChart.TChart)sender).Graphics3D.TextOut(20, 20, "hello world");
}
Regards,
Marc Meumann
Steema Support

coldwind
Newbie
Newbie
Posts: 41
Joined: Tue Dec 27, 2022 12:00 am

Re: How to set the X with category data?

Post by coldwind » Tue Aug 22, 2023 12:37 pm

Mean chart code as follow
Average.png
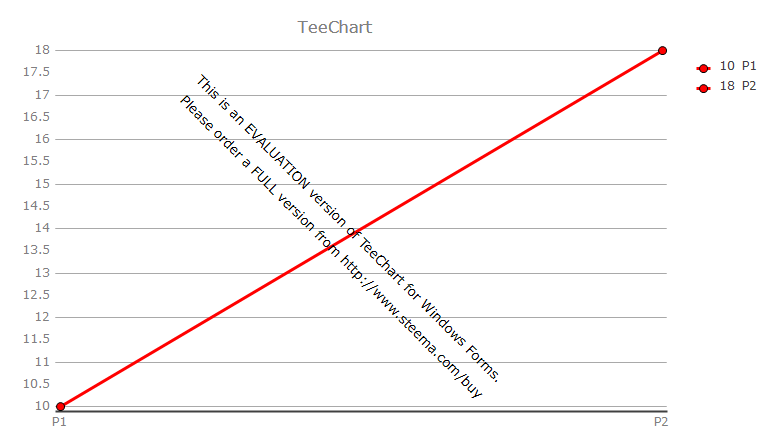
Average.png (21.8 KiB) Viewed 13548 times

Code: Select all

public class ProductInfo
        {
            public string Product { get; set; }
            public int Y { get; set; }
        }
        List<ProductInfo> rawList = new List<ProductInfo>()
        {
            new ProductInfo() { Product = "P1", Y = 10 },
            new ProductInfo() { Product = "P2", Y = 18 }
        };
        public RawDataAverage()
        {
            InitializeComponent();
            Line line = new Line(tChart1.Chart);
            InitializeChart(rawList, line);
        }
        private void InitializeChart(List<ProductInfo> list, Line line)
        {
            line.LinePen.Width = 3;
            line.Color = Color.Red;
            line.Pointer.Visible = true;
            line.Pointer.Style = PointerStyles.Circle;
            line.YValues.DataMember = "Y";
            line.LabelMember = "Product";
            System.Console.WriteLine(rawList);
            line.Add(rawList as IList);
        }
RawData chart code as follow
RawData .png
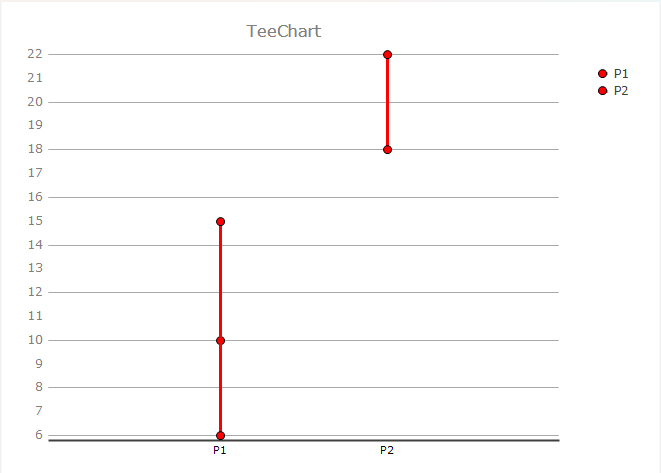
RawData .png (9.87 KiB) Viewed 13548 times

Code: Select all

public partial class Form1 : Form
    {

        public Form1()
        {
            InitializeComponent();

            var line1 = new Line(tChart1.Chart);
            var line2 = new Line(tChart1.Chart);

            var product1 = "P1";
            var product2 = "P2";

            InitializeChart(line1, product1);
            InitializeChart(line2, product2);

            tChart1.Axes.Bottom.SetMinMax(-1, 2);

            //with more than one series in the chart we need to set the 
            //labels manually like this:
            tChart1.Axes.Bottom.Labels.Items.Add(0, product1);
            tChart1.Axes.Bottom.Labels.Items.Add(1, product2);
            tChart1.DoubleClick += new EventHandler(this.chart_DoubleClick);
        }

        public class ProductInfo
        {
            public string Product { get; set; }
            public int Y { get; set; }
            public int X { get; set; }
        }

        List<ProductInfo> list = new List<ProductInfo>()
        {
            new ProductInfo() { X = 0,  Product = "P1", Y = 10 },
            new ProductInfo() { X = 0, Product = "P1", Y = 15 },
            new ProductInfo() { X = 0, Product = "P1", Y = 6 },
            new ProductInfo() { X = 1, Product = "P2", Y = 22 },
            new ProductInfo() { X = 1, Product = "P2", Y = 18 }
        };

        private void InitializeChart(Line line, string select)
        {
            line.LinePen.Width = 3;
            line.Color = Color.Red;
            line.Pointer.Visible = true;
            line.Pointer.Style = PointerStyles.Circle;
            line.YValues.DataMember = "Y";
            line.XValues.DataMember = "X";
            line.LabelMember = "Product";
            line.Title = select;
            line.Add(list.Where(x => x.Product == select).ToList() as IList);
        }
    }
Question1: When RawData Chart has a lot of data, the X-axis labels are stacked together. Want to clearly show how to deal with them?
The following figure shows an example of X-axis labels stacked together
x label.png
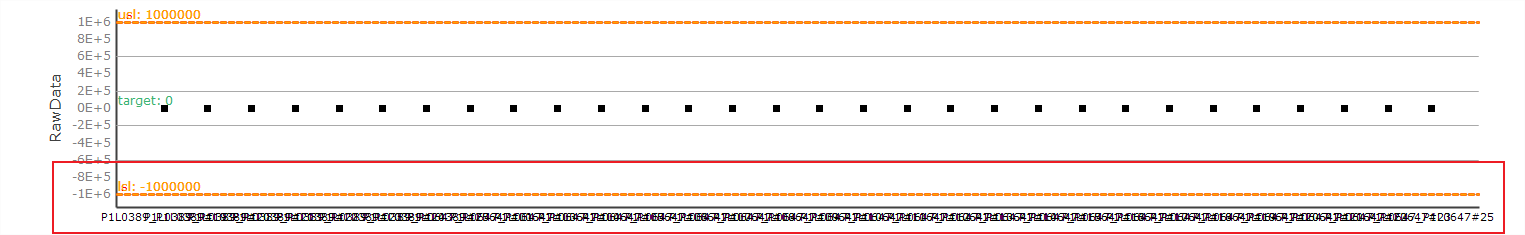
x label.png (13.42 KiB) Viewed 13548 times
Question2:Average Chart and RawData ,the X-axis is the same and I want to share an X-axis

coldwind
Newbie
Newbie
Posts: 41
Joined: Tue Dec 27, 2022 12:00 am

Re: How to set the X with category data?

Post by coldwind » Tue Aug 22, 2023 12:44 pm

Average Chart and RawData ,the X-axis is the same and I want to share an X-axis
share an X-axis.png
share an X-axis.png (8.41 KiB) Viewed 13541 times


The following is an example of four graphs sharing an X-axis,I expect the same for my two drawings
example.png
example.png (102.78 KiB) Viewed 13419 times

Marc
Site Admin
Site Admin
Posts: 1217
Joined: Thu Oct 16, 2003 4:00 am
Location: Girona
Contact:

Re: How to set the X with category data?

Post by Marc » Wed Aug 23, 2023 2:38 pm

Hello,

Question 1.

I suggest that either you make the labels multiline (can use \n char) or put the labels angle to 90º.

We will look at ways to better plot default labels for contiguous series.

Regards,
Marc Meumann
Steema Support

Marc
Site Admin
Site Admin
Posts: 1217
Joined: Thu Oct 16, 2003 4:00 am
Location: Girona
Contact:

Re: How to set the X with category data?

Post by Marc » Wed Aug 23, 2023 2:42 pm

Question 2.

Similar to the link I sent you in an earlier email you would place the charts one above the other, use the same SetMinMax axis settings and set AxisLabels Visible false for the top chart. Best to fix left and right margins for both charts. What particular problems are you encountering?

Regards,
Marc
Steema Support

coldwind
Newbie
Newbie
Posts: 41
Joined: Tue Dec 27, 2022 12:00 am

Re: How to set the X with category data?

Post by coldwind » Mon Aug 28, 2023 1:28 am

Hello, you do not understand what I mean, the last example diagram, the four diagrams are separate diagrams, but the X-axis is only the last diagram, and the other three diagrams share the last X-axis, their points are the same vertically

Post Reply