Page 1 of 1
Custom 3D series points limitation
Posted: Mon Aug 13, 2007 10:24 am
by 13045625
Dear All
Is the maximum number of points in any of the custom3Dseries still limited to 2000? I am using 2048 x 50 in the ColorGrid series and although there is some slowness in redrawing it does allow this (although there is still a problem when irregular grid is set to true).
Are there any plans to increase the maximum number of points for these series?
Posted: Mon Aug 13, 2007 11:04 am
by narcis
Hi jenb,
This limit has already been increased to 20000x20000 cells per grid in v3 but it is still 2000x2000 in v2. Which TeeChart version are you using?
Could you please send us a simple example project we can run "as-is" to reproduce the issue when IrregularGrid=true?
You can post your files at news://
www.steema.net/steema.public.attachments newsgroup or at our
upload page.
Thanks in advance.
Posted: Mon Aug 13, 2007 12:15 pm
by 13045625
Hi Narcis
I am using the latest TeeChart - version 3.2.2763.26082. I previously posted a project at your upload page - simple.zip. The original email for this is at:
http://www.teechart.net/support/viewtop ... ght=#24238
It is still a problem that I can't swap between the regular and regular grid, also that the chart is slow to update (e.g. if another window has been overlapping), but maybe I need to specifically call the update event?
Let me know if you need more information.
Regards
jenb
Posted: Mon Aug 13, 2007 1:20 pm
by narcis
Hi jenb,
Thanks for the information.
Yes, this issue (TF02012357) hasn't been fixed yet but it's I high-priority item in the bug list.
Regarding the slow updating problem, it may be related to the issue affecting all System.Windows.Forms.Control objects we discussed
here.
Posted: Mon Aug 13, 2007 1:56 pm
by 13045625
Thanks Narcis
Would there be any advantage in using the SurfaceSeries rather than the ColorGrid?
Posted: Mon Aug 13, 2007 2:07 pm
by narcis
Hi jenb,
You could try using Surface series, it may produce a different output than ColorGrid series. However, to have the surface looking like a ColorGrid you'll have to set chart's rotation to 360º and elevation to 270º. This will make axes not being plotted as with ColorGrid series.
You can try just changing the series style using ChangeType method as shown
here.
Custom 3D series problem
Posted: Wed Jan 16, 2008 2:55 pm
by 13045625
Dear Steema
I wondered if the issue TF02012357 has been fixed yet? If not is there any update on it (e.g. plans for when it might be fixed)
narcis wrote:
Yes, this issue (TF02012357) hasn't been fixed yet but it's I high-priority item in the bug list.
Regarding the slow updating problem, it may be related to the issue affecting all System.Windows.Forms.Control objects we discussed
here.
Regards
jenb
Posted: Wed Jan 16, 2008 6:03 pm
by narcis
Dear jenb,
No, this issue hasn't been fixed yet. As told before, it is a high-priority item in the bug list. However, this is quite a complex one and may involve some ColorGrid's redesign. Therefore I'm sorry to say that we can't provide an estimate date at the moment.
Re: Custom 3D series points limitation
Posted: Tue Mar 28, 2017 9:12 am
by 15678995
I am now using TeeChart V2016 and the ColorGrid series. I want to plot 40000 x 101 points. Is this possible? Are any particular settings recommended for the ColorGrid series with a large number of points. if not possible do you recommended another series type, e.g. Surface Series?
Re: Custom 3D series points limitation
Posted: Wed Mar 29, 2017 11:02 am
by Christopher
Hello,
jenb wrote:I am now using TeeChart V2016 and the ColorGrid series. I want to plot 40000 x 101 points. Is this possible? Are any particular settings recommended for the ColorGrid series with a large number of points. if not possible do you recommended another series type, e.g. Surface Series?
Revisiting
this post of mine, I believe things have changed slightly. Using this code in TeeChart.NET gives us the corresponding image:
Code: Select all
    private Steema.TeeChart.Styles.ColorGrid colorGrid;
    private void InitializeChart()
    {
      double x, y, z;
      Random rnd = new Random();
      int length = 2;

      tChart1.Aspect.View3D = false;
      tChart1.Series.Add(colorGrid = new Steema.TeeChart.Styles.ColorGrid());
      colorGrid.IrregularGrid = false;

      for (int i = 0; i <= length; i++)
      {
        x = i * i;
        for (int j = 0; j <= length; j++)
        {
          z = j;
          y = rnd.NextDouble();
          colorGrid.Add(x, y, z);
        }
      }
    }
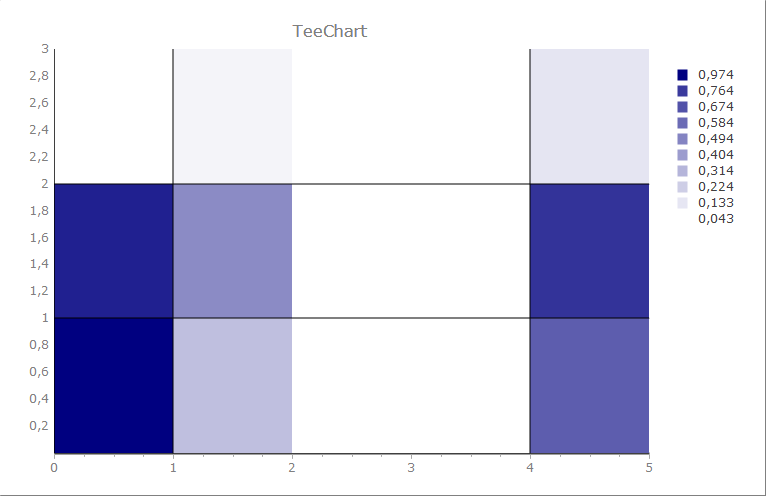
- TChart636263774780721860.png (11.98 KiB) Viewed 15285 times
whereas in ActiveX/Delphi we have:
Code: Select all
procedure TForm1.InitializeChart;
var
  colorGrid : TColorGridSeries;
  x, y, z : Double;
  length, i, j : Integer;
begin
     colorGrid := TColorGridSeries.Create(Self);
     colorGrid.ParentChart := Chart1;

         length := 2;

         Chart1.View3D := false;
         colorGrid.IrregularGrid := true;

         for i := 0 to length do
      begin
            x := i * i;
            for j := 0 to length - 1 do
        begin
               z := j;
               y := Random;
               colorGrid.AddXYZ(x, y, z);
        end;
      end;
end;
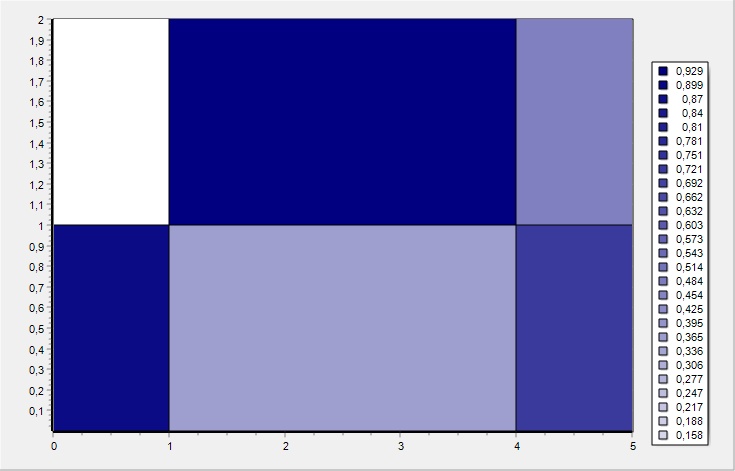
- Chart42823,5363522569.jpg (51.64 KiB) Viewed 15286 times
I think TeeChart.NET has been improved in this area. With respect to plotting so many points, can you please repost the example project so I can look at it again? The passage of time has left me without access to your original one, I'm afraid.