TeeChart for Microsoft Visual Studio .NET, Xamarin Studio (Android, iOS & Forms) & Monodevelop.
-
AIS
- Newbie

- Posts: 70
- Joined: Wed Jun 25, 2008 12:00 am
Post
by AIS » Fri Sep 19, 2008 10:30 am
Hello,
i am using customlabels for my histogram chart, but the first and last label isn`t drawn by the chart. Is it possible to do this with a property of the axes or something like that? The only way i think is to use the offset. Unfortunately this solution is not equal to my requirements.
For better understanding here is an image:

Thanks in advance!
-
Narcís
- Site Admin

- Posts: 14730
- Joined: Mon Jun 09, 2003 4:00 am
- Location: Banyoles, Catalonia
-
Contact:
Post
by Narcís » Fri Sep 19, 2008 11:07 am
Hi AIS,
One option is using offset as you already suggested. An alternative is doing something as in the
All Features\Welcome !\Axes\First and Last labels example in the features demo, available at TeeChart's program group.
If this doesn't help, could you please send us a simple example project we can run "as-is" to reproduce the problem here? You can post your files at news://
www.steema.net/steema.public.attachments newsgroup or at our
upload page.
Thanks in advance.
-
AIS
- Newbie
- Posts: 70
- Joined: Wed Jun 25, 2008 12:00 am
Post
by AIS » Fri Sep 19, 2008 11:37 am
Hello Narcís,
thank for the quick response!
The solution with the GetAxisDrawLabel doesn`t seem to work, because the first and last label isn`t drawn. I have made a short example code for you with the same result. If you scrolling to the left/right you can see, that there is a minimum/maximum label.
Code: Select all
Steema.TeeChart.TChart chart = new Steema.TeeChart.TChart();
chart.Dock = DockStyle.Fill;
chart.Aspect.View3D = false;

this.Controls.Add(chart);

Steema.TeeChart.Styles.Histogram histo = new Steema.TeeChart.Styles.Histogram();

for (int i = 1; i <= 10; i++)
{
      histo.Add(i-0.5,i);
}

chart.Axes.Bottom.Labels.Items.Clear();

for (int i = 0; i <= histo.XValues.Count; i++)
{
      chart.Axes.Bottom.Labels.Items.Add(i);
}

chart.Series.Add(histo);
-
Narcís
- Site Admin
- Posts: 14730
- Joined: Mon Jun 09, 2003 4:00 am
- Location: Banyoles, Catalonia
-
Contact:
Post
by Narcís » Fri Sep 19, 2008 1:59 pm
Hi AIS,
Adding custom labels as shown in the code snippet below adds one label for each histogram series bar.
Code: Select all
			tChart1.Axes.Bottom.Labels.Items.Clear();

			for (int i = 0; i <= histo.XValues.Count; i++)
			{
				//tChart1.Axes.Bottom.Labels.Items.Add(i);
				tChart1.Axes.Bottom.Labels.Items.Add(histo.XValues[i], i.ToString());
			}
Does this fit your needs?
-
AIS
- Newbie
- Posts: 70
- Joined: Wed Jun 25, 2008 12:00 am
Post
by AIS » Fri Sep 19, 2008 2:50 pm
Hello,
not really. Because i want to display the labels between (not in) the bars. The problem in this case is, that labels in positions near the border of the chart are not drawn. I need an Offset of 35pixel to show them, but i would like draw the histogram without any offset at the bottom axes. Is this possible? If not, i must use offset

Thanks in advanece!
-
Narcís
- Site Admin
- Posts: 14730
- Joined: Mon Jun 09, 2003 4:00 am
- Location: Banyoles, Catalonia
-
Contact:
Post
by Narcís » Fri Sep 19, 2008 2:58 pm
Hello AIS,
Using standard labels, as shown in the code snippet below, doesn't hide first and last labels for me here. Which TeeChart version are you using?
Code: Select all
		public Form1()
		{
			InitializeComponent();
			InitializeChart();
		}

		private void InitializeChart()
		{
			tChart1.Aspect.View3D = false;

			Steema.TeeChart.Styles.Histogram histo = new Steema.TeeChart.Styles.Histogram(tChart1.Chart);

			for (int i = 1; i <= 10; i++)
			{
				histo.Add(i - 0.5, i);
			}

			//tChart1.Axes.Bottom.Labels.Items.Clear();

			//for (int i = 0; i <= histo.XValues.Count; i++)
			//{
			//  tChart1.Axes.Bottom.Labels.Items.Add(i);
			//}
		}
Thanks in advance.
-
AIS
- Newbie
- Posts: 70
- Joined: Wed Jun 25, 2008 12:00 am
Post
by AIS » Fri Sep 19, 2008 3:21 pm
Hello,
yes it does, but with some other problems. The first image show the situation with automatic labels. The labels are also drawn within an bar and not always between two bars, that can i avoid, if i set the increment, but then the labels shifted in the wrong way like you can see in the second image.


-
Narcís
- Site Admin
- Posts: 14730
- Joined: Mon Jun 09, 2003 4:00 am
- Location: Banyoles, Catalonia
-
Contact:
Post
by Narcís » Fri Sep 19, 2008 3:28 pm
Hi AIS,
Could you please send us a simple example project we can run "as-is" to reproduce the problem here?
Thanks in advance.
-
AIS
- Newbie
- Posts: 70
- Joined: Wed Jun 25, 2008 12:00 am
Post
by AIS » Mon Sep 22, 2008 3:06 pm
Hello
with the code below, you can reproduce my problem
Code: Select all
Steema.TeeChart.TChart chart = new Steema.TeeChart.TChart();
chart.Dock = DockStyle.Fill;
chart.Aspect.View3D = false;
Random x = new Random(3);

this.Controls.Add(chart);

Steema.TeeChart.Styles.Histogram histo = new Steema.TeeChart.Styles.Histogram();

for (int i = 1; i <= 10; i++)
{
   histo.Add((3.242 * i) - (3.242 / 2) + 5, x.Next(234)); // odd width (3.42), non-zero start (+5)
}

chart.Axes.Bottom.Increment = 3.242;

/*
chart.Axes.Bottom.Labels.Items.Clear();

chart.Axes.Bottom.Labels.Items.Add(histo.XValues[0] - (3.242 / 2));

for (int i = 0; i < histo.XValues.Count; i++)
{
   //tChart1.Axes.Bottom.Labels.Items.Add(i);
   chart.Axes.Bottom.Labels.Items.Add(histo.XValues[i] + (3.242 / 2));
}
*/

chart.Series.Add(histo);
I found out, that the automatic labels didn`t do that what i requested if there are two conditions true. First, the bars width is odd and second, the first bar start is non zero.
-
Narcís
- Site Admin
- Posts: 14730
- Joined: Mon Jun 09, 2003 4:00 am
- Location: Banyoles, Catalonia
-
Contact:
Post
by Narcís » Mon Sep 22, 2008 3:45 pm
Hi AIS,
Thanks for the information.
Using the code you posted with latest TeeChart for .NET v3 release available at the client area I get this chart:
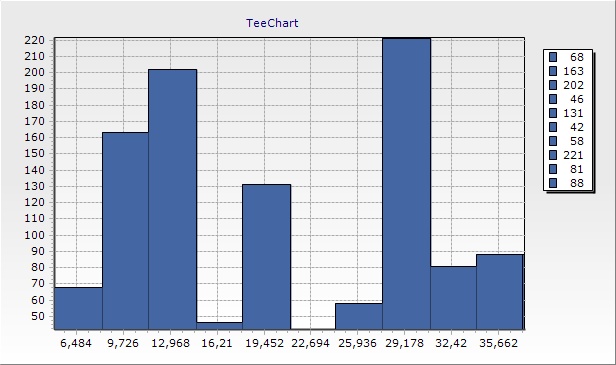
As you can see all labels are visible. Is this the chart you get? Which TeeChart version are you using?
Thanks in advance.
-
AIS
- Newbie
- Posts: 70
- Joined: Wed Jun 25, 2008 12:00 am
Post
by AIS » Tue Sep 23, 2008 6:39 am
Hello Narcís,
yes, the same i get with my tchart version (latest realease, not from yesterday
). But i expected this label allocation (first/last is reworked in paint)

-
Narcís
- Site Admin
- Posts: 14730
- Joined: Mon Jun 09, 2003 4:00 am
- Location: Banyoles, Catalonia
-
Contact:
Post
by Narcís » Tue Sep 23, 2008 11:22 am
Hi AIS,
Thanks for the information.
Ok, in that case you can achieve what you request using GetNextAxisLabel event like this:
Code: Select all
		public Form1()
		{
			InitializeComponent();
			InitializeChart();
		}

		private void InitializeChart()
		{
			tChart1.Aspect.View3D = false;
			tChart1.Dock = DockStyle.Fill;

			Random x = new Random(3);

			Steema.TeeChart.Styles.Histogram histo = new Steema.TeeChart.Styles.Histogram(tChart1.Chart);

			for (int i = 1; i <= 10; i++)
			{
				histo.Add((3.242 * i) - (3.242 / 2) + 5, x.Next(234)); // odd width (3.42), non-zero start (+5)
			}

			tChart1.Axes.Bottom.Increment = 3.242;

			//tChart1.Axes.Bottom.Labels.Items.Clear();

			//tChart1.Axes.Bottom.Labels.Items.Add(histo.XValues[0] - (3.242 / 2));

			//for (int i = 0; i < histo.XValues.Count; i++)
			//{
			//  //tChart1.Axes.Bottom.Labels.Items.Add(i);
			//  tChart1.Axes.Bottom.Labels.Items.Add(histo.XValues[i] + (3.242 / 2));
			//}

			tChart1.GetNextAxisLabel += new Steema.TeeChart.GetNextAxisLabelEventHandler(tChart1_GetNextAxisLabel);
		}

		private bool first = true;
		private double newValue;

		void tChart1_GetNextAxisLabel(object sender, Steema.TeeChart.GetNextAxisLabelEventArgs e)
		{
			double seriesIncrement = tChart1[0].XValues[1] - tChart1[0].XValues[0];

			if ((sender as Steema.TeeChart.Axis).Equals(tChart1.Axes.Bottom))
			{
				e.Stop = false;

				if (first)
				{
					newValue = e.LabelValue;
					first = false;
				}
				else
				{
					newValue += seriesIncrement;
				}

				if (e.LabelIndex == 0)
				{
					e.LabelValue = tChart1.Axes.Bottom.CalcPosPoint(tChart1.Axes.Left.Position);
				}
				else
				{
					if (e.LabelIndex == tChart1[0].Count)
					{
						e.LabelValue = tChart1.Axes.Bottom.CalcPosPoint(tChart1.Axes.Bottom.IEndPos);
					}
					else
					{
						if (e.LabelIndex < tChart1[0].Count)
						{
							e.LabelValue = newValue;
						}
						else
						{
							e.Stop = true;
							first = true;
						}
					}
				}
			}
		}
-
AIS
- Newbie
- Posts: 70
- Joined: Wed Jun 25, 2008 12:00 am
Post
by AIS » Tue Sep 23, 2008 12:14 pm
Hello Narcís,
yes, this code does what i expected. Thanks!
In that case, i have resized the chart to check the labels and i was wondering about the first label and the offset of the grid in reference to the bars. It looks like the first and last bar isn`t fully visible, because the x-values aren`t the start/endpositions of the bars. I could use a minimumoffset for the bottom axes of 33pixel without a visible gab between the first bar and the left axes. In combination with resizing and the offset it looks really confusing for me, because the first bar is moving? Is this behavior normal?
Thanks anyway for the code, it solves my problem now =)
-
Narcís
- Site Admin
- Posts: 14730
- Joined: Mon Jun 09, 2003 4:00 am
- Location: Banyoles, Catalonia
-
Contact:
Post
by Narcís » Tue Sep 23, 2008 1:02 pm
Hi AIS,
You're welcome.
I could reproduce this here. Same happens without offset when making the chart smaller. I've added the issue to the wish-list to be investigated and enhanced for next releases.


