
Previous | Next
|
|
Contents page Previous | Next |
The TChart Series class is the common ancestor for all Series types. When using the TeeChart online help or referencing the html help pages via the tutorials, to obtain help on any Series Type, take a look at Series properties and methods on the Series Type's help page where a list of all inherited properties and methods will be included.
As a little background on the structure of the TeeChart Type Library, here is an explanation of the Series Classes and interfaces. The diagram below shows the relationship between TeeChart Series classes. All classes derive from the generic "Series" class and thus share "Series" properties and methods. Several other generic Classes derive from Series (CustomSeries, CustomBarSeries and CircledSeries), these are highlighted in green and their interfaces are not directly accessible for programming, their characteristics are inherited by their descendant Series types. All derived Series (in red) are accessible in the TeeChart gallery for inclusion in your Chart. TeeChart Series, derived in this way, allow programmable access via a common index structure (see example code later in this section).
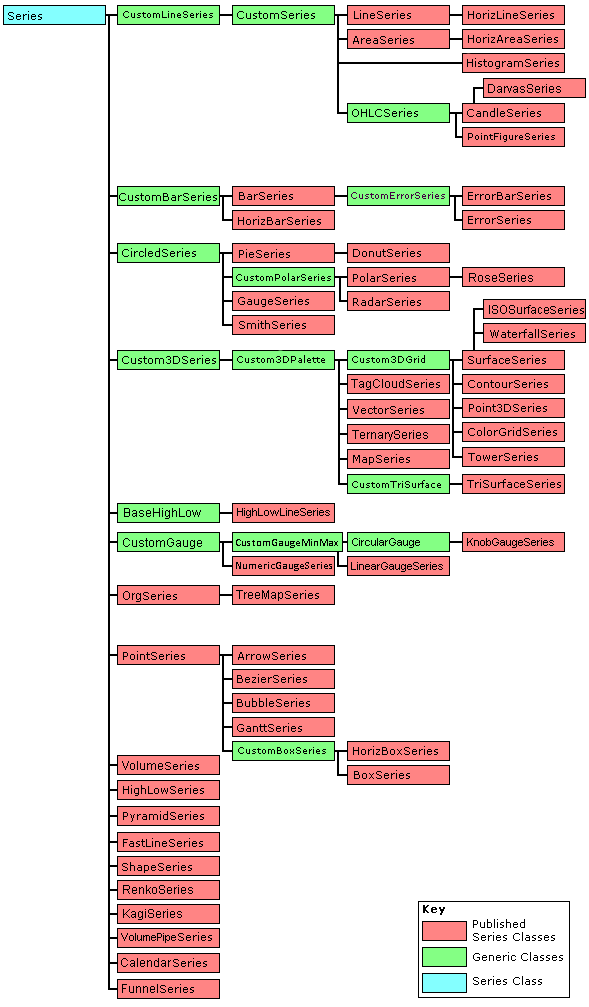 | TeeChart Pro's internal Series Class hierarchy |
The Activex Type Library presents the classes, as interfaces, in a linear form. Thus presenting a homogenous approach to accessing any Series Type specific properties and methods. Common properties and methods are directly accessible in the Series interface.
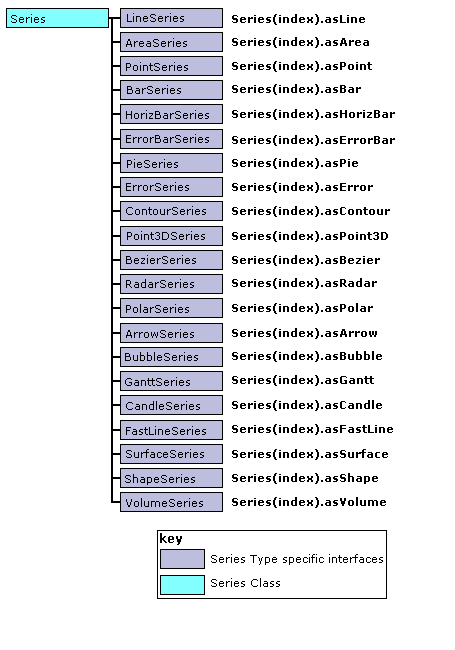 |
Shows how TeeChart Pro's Series' interfaces can be accessed. |
An example of mixing different series classes in the same Chart would be to add a Area (Series(0)), Bar (Series(1)) and Line (Series(2)) Series to a Chart using the Chart Editor at design time. All access a common index structure, the Chart's Series list. To work with the Series may look something like the below:
'You could add the Series at runtime
With TChart1
  .AddSeries scArea
  .AddSeries scBar
  .AddSeries scLine
End With

With TChart1
  'Use Series common properties
  .Series(0).FillSampleValues 10  '  Put random values in the Area Series
  .Series(1).FillSampleValues 10  '  Put random values in the Bar Series
  .Series(2).FillSampleValues 10  '  Put random values in the Line Series
  .Series(1).Marks.Visible = False '  Bar Series default is Marks 'On', turn them off
  .Series(2).Marks.Visible = True '  Line Series default is Marks 'Off', turn them on
  With TChart1.Series(1).asBar
    'Modify Bar specific properties
    .BarStyle = bsPyramid  ' Change Bar type
    .BarPen.Color = vbCyan ' Bar bounding lines colour
  End With
  With TChart1.Series(2).asLine
    'Modify Line specific properties
    .Stairs = True  '  Set line to Stairs
    .LinePen.Color = vbBlue  ' LineSeries bounding lines colour
  End With
  With TChart1.Series(0).asArea
    'Modify Area specific properties
    .AreaBrush = bsFDiagonal ' Area fill pattern
  End With
End With
Choosing a Series Type for a Chart will very much depend on your own requirements for the Chart. There are occasions however, when due to the number of variables to plot, the choice of Chart may depend on which Series types support the number of input variables. The following table shows the number of variables allowed by some Series types. For the brevity of this tutorial we haven't included all the possible Series types offered with TeeChart.
|
Series Type |
No. of variables |
Datasource Properties |
|
Basic |
||
|
Gantt |
3 |
StartValues, EndValues, AY (Y axis level), AXLabel (Label optionally shown on Y-axis or as mark) |
|
Shape |
4 |
X0 (Top), Y0 (Bottom), X1 (Left), Y1 (Right) |
|
Bubble |
3 |
XValues, YValues, XLabel, RadiusValues |
|
Line |
2 |
XValues, YValues, XLabel |
|
Bar |
2 |
XValues, YValues (called Bar), XLabel |
|
HorizBar |
2 |
XValues, YValues (called Bar), XLabel |
|
Area |
2 |
XValues, YValues, XLabel |
|
Point |
2 |
Xvalues, YValues, XLabel |
|
Pie |
1 |
PieValues, XLabel |
|
Fast Line |
2 |
XValues, YValues, XLabel |
|
HorizLine |
2 |
XValues, YValues, YLabel |
|
HorizArea |
2 |
XValues, YValues, YLabel |
|
3D |
||
|
Surface |
3 |
XValues, YValues, XLabel, ZValues |
|
Contour |
3 |
XValues, YValues, XLabel, ZValues |
|
Waterfall |
3 |
XValues, YValues, XLabel, ZValues |
|
Color Grid |
3 |
XValues, YValues, XLabel, ZValues |
|
Vector 3D |
3 |
XValues, YValues, XLabel, ZValues |
|
Tower |
3 |
XValues, YValues, XLabel, ZValues |
|
Point3D |
3 |
XValues, YValues, XLabel, ZValues |
|
Triangle Surf. |
3 |
XValues, YValues, XLabel, ZValues |
|
Other |
||
|
Bar 3D |
3 |
XValues, YValues, YStartPoint, XLabel |
|
Image Bar |
2 |
XValues, YValues, XLabel |
|
Wind Rose |
2 |
Angle, YValues, Labels |
|
Clock |
2 |
Angle, YValues, Labels |
|
Line Point |
2 |
XValues, YValues, XLabel |
|
Bar Join |
2 |
XValues, YValues, XLabel |
|
Calender |
2 |
XValues, YValues, Labels |
|
Big Candle |
5 |
OpenValues, CloseValues, HighValues, LowValues, DateValues |
|
ImagePoint |
2 |
XValues, YValues, XLabel |
|
DeltaPoint |
2 |
XValues, YValues, XLabel |
|
Extended |
||
|
Polar |
2 |
XValues, YValues, Labels (Polar has Angle and Radius) |
|
Radar |
2 |
XValues, YValues, Labels (Radar has Angle and Radius) |
|
Arrow |
4 |
StartXValues, StartYValues, XLabel, EndXValues, EndYValues |
|
Bezier |
2 |
XValues, YValues, XLabel |
|
Donut |
2 |
Angle, YValues, Labels |
|
Smith |
2 |
Resistance, Reactance, Labels |
|
Pyramid |
2 |
XValues, YValues, XLabels |
|
Map |
3 |
XValues, YValues, Polygons, Labels |
|
Gauge |
1 |
YValues |
|
Financial |
||
|
Candle |
5 |
OpenValues, CloseValues, HighValues, LowValues, DateValues |
|
Volume |
2 |
XValues, YValues (VolumeValues), XLabel |
|
Point & Figure |
5 |
OpenValues, CloseValues, HighValues, LowValues, DateValues |
|
Stats |
||
|
Error |
3 |
XValues, YValues, XLabel, StdErrorValues |
|
Error Bar |
3 |
XValues, YValues, XLabel, ErrorValues |
|
High-Low |
3 |
XValues, YValues, LowValues, XLabel |
|
Histogram |
2 |
XValues, YValues, XLabel |
|
BoxPlot |
2 |
XValues, SamplesValues, Label |
|
Horizontal BoxPlot |
2 |
XValues, SamplesValues, Label |
|
Funnel |
3 |
XValues, QuoteValues, OpportunityValues, XLabel |
Labelling can be used to extend the value of a 2 variable Series Type. See the example below that uses 3 instances of the Bar Series type in the same Chart.
Example
Uses Bar Series types
| Product code | Month | Quantity produced |
| 10 | Jan | 300 |
| 10 | Feb | 325 |
| 10 | Mar | 287 |
| 12 | Jan | 175 |
| 12 | Feb | 223 |
| 12 | Mar | 241 |
| 14 | Jan | 461 |
| 14 | Feb | 470 |
| 14 | Mar | 455 |
In its simplest form, the data produces the following Chart, grouping the information by month:

or (grouping by product):

We have added new values to the table above (Stock).
| Product code | Month | Quantity produced | Stock level |
| 10 | Jan | 300 | 600 |
| 10 | Feb | 325 | 715 |
| 10 | Mar | 287 | 676 |
| 12 | Jan | 175 | 245 |
| 12 | Feb | 223 | 270 |
| 12 | Mar | 241 | 315 |
| 14 | Jan | 461 | 800 |
| 14 | Feb | 470 | 755 |
| 14 | Mar | 455 | 835 |
The values of stock in the table are generally higher than those of monthly production so displaying them gives the following chart (2D this time). The Chart uses Line Series to differentiate Stocks.

Most Series types (other than ODBC datasources Tutorial 8 and Functions Tutorial 7) use the Add and ADDXY methods for adding data. There are some exceptions, see the following table for examples of how they can differ:
| Series Type | Add Series points | Delete Series points |
|
Basic |
||
|
Gantt |
GanttSeries.AddGantt GanttSeries.AddGanttColor |
Series.Delete |
|
Shape |
ShapeSeries.X0, ShapeSeries.Y0, ShapeSeries.X1, ShapeSeries.Y1 |
TChart.RemoveSeries |
|
Bubble |
BubbleSeries.AddBubble |
Series.Delete |
|
Line |
Series.Add Series.AddXY Series.AddNull Series.AddNullXY Series.AddArray |
Series.Delete |
|
Bar |
Series.Add Series.AddXY Series.AddNull Series.AddNullXY Series.AddArray |
Series.Delete |
|
HorizBar |
Series.Add Series.AddXY Series.AddNull Series.AddNullXY Series.AddArray |
Series.Delete |
|
Area |
Series.Add Series.AddXY Series.AddNull Series.AddNullXY Series.AddArray |
Series.Delete |
|
Point |
Series.Add Series.AddXY Series.AddNull Series.AddNullXY Series.AddArray |
Series.Delete |
|
Pie |
Series.Add Series.AddNull Series.AddArray |
Series.Delete |
|
Fast Line |
FastLineSeries.AddRealTime Series.Add Series.AddXY Series.AddNull Series.AddNullXY Series.AddArray |
Series.Delete |
|
HorizLine |
Series.Add Series.AddXY Series.AddNull Series.AddNullXY Series.AddArray |
Series.Delete |
|
HorizArea |
Series.Add Series.AddXY Series.AddNull Series.AddNullXY Series.AddArray |
Series.Delete |
|
3D |
||
|
Surface |
SurfaceSeries.AddXYZ SurfaceSeries.AddArrayXYZ SurfaceSeries.AddArrayGrid |
Series.Delete |
|
Contour |
ContourSeries.AddXYZ ContourSeries.AddArrayXYZ ContourSeries.AddArrayGrid |
Series.Delete |
|
Waterfall |
Waterfall.AddXYZ Waterfall.AddArrayXYZ Waterfall.AddArrayGrid |
Series.Delete |
|
Color Grid |
ColorGrid.AddXYZ ColorGrid.AddArrayXYZ ColorGrid.AddArrayGrid |
Series.Delete |
|
Vector 3D |
Vector3D.AddVector Vector3D.AddXYZ Vector3D.AddArrayXYZ Vector3D.AddArrayGrid |
Series.Delete |
|
Tower |
Tower.AddXYZ Tower.AddArrayXYZ Tower.AddArrayGrid |
Series.Delete |
|
Point3D |
Point3DSeries.AddXYZ |
Series.Delete |
|
Triangle Surf. |
TriSurface.AddXYZ TriSurface.AddArrayXYZ TriSurface.AddArrayGrid |
Series.Delete |
|
Other |
||
|
Bar 3D |
Bar3D.AddBar Series.Add Series.AddXY Series.AddNull Series.AddNullXY Series.AddArray |
Series.Delete |
|
Image Bar |
Series.Add Series.AddXY Series.AddNull Series.AddNullXY Series.AddArray |
Series.Delete |
|
Wind Rose |
Series.Add Series.AddXY Series.AddNull Series.AddNullXY Series.AddArray |
Series.Delete |
|
Clock |
None |
None |
|
Line Point |
Series.Add Series.AddXY Series.AddNull Series.AddNullXY Series.AddArray |
Series.Delete |
|
Bar Join |
Series.Add Series.AddXY Series.AddNull Series.AddNullXY Series.AddArray |
Series.Delete |
|
Calender |
Calendar.Date |
None |
|
Big Candle |
|
|
|
ImagePoint |
Series.Add Series.AddXY Series.AddNull Series.AddNullXY Series.AddArray |
Series.Delete |
|
DeltaPoint |
Series.Add Series.AddXY Series.AddNull Series.AddNullXY Series.AddArray |
Series.Delete |
|
Extended |
||
|
Polar |
PolarSeries.AddPolar |
Series.Delete |
|
Radar |
Series.Add Series.AddXY Series.AddNull Series.AddNullXY Series.AddArray |
Series.Delete |
|
Arrow |
ArrowSeries.AddArrow |
Series.Delete |
|
Bezier |
Series.Add Series.AddXY Series.AddNull Series.AddNullXY Series.AddArray |
Series.Delete |
|
Donut |
Series.Add Series.AddXY Series.AddNull Series.AddNullXY Series.AddArray |
Series.Delete |
|
Smith |
Series.Add Series.AddXY Series.AddNull Series.AddNullXY Series.AddArray |
Series.Delete |
|
Pyramid |
Series.Add Series.AddXY Series.AddNull Series.AddNullXY Series.AddArray |
Series.Delete |
|
Map |
Map.Shapes.Add |
Series.Delete |
|
Gauge |
Gauge.Value |
None |
|
Financial |
||
|
Candle |
CandleSeries.AddCandle |
Series.Delete |
|
Volume |
Series.Add Series.AddXY Series.AddNull Series.AddNullXY Series.AddArray |
Series.Delete |
|
Point & Figure |
PointFigure.AddOHLC |
Series.Delete |
|
Stats |
||
|
Error |
ErrorSeries.AddErrorBar |
Series.Delete |
|
Error Bar |
ErrorBarSeries.AddErrorBar |
Series.Delete |
|
High-Low |
HighLow.AddHighLow |
Series.Delete |
|
Histogram |
Series.Add Series.AddXY Series.AddNull Series.AddNullXY Series.AddArray |
Series.Delete |
|
BoxPlot |
BoxPlot.Median BoxPlot.Quartile1 BoxPlot.Quartile3 BoxPlot.InnerFence1 BoxPlot.InnerFence3 BoxPlot.OuterFence1 BoxPlot.OuterFence3 |
TChart.RemoveSeries |
|
Horizontal BoxPlot |
BoxPlot.Median BoxPlot.Quartile1 BoxPlot.Quartile3 BoxPlot.InnerFence1 BoxPlot.InnerFence3 BoxPlot.OuterFence1 BoxPlot.OuterFence3 |
TChart.RemoveSeries |
|
Funnel |
Funnel.AddSegment |
Series.Delete |
Note that Series that do not use the Add or AddXY method, have their Series specific data add method accessible in the series."as[SeriesType]" property (eg. AddCandle at Series.asCandle.AddCandle; AddGantt at Series.asGantt.AddGantt). See the note on Typecasting.
Colour
Colour may be manually added for a point when adding the point
Example
TChart1.Series(0).Add 46, "My first value", vbYellow
Alternatively use the TeeChart constant clTeeColor, telling TeeChart to allocate a colour. TeeChart will choose one of up to 16 unique and as yet unused colours for each new Series.
Example
TChart1.Series(0).Add 46, "My first value", clTeeColor
A 'Non-colour' may be added for a Point to reserve a space for the value in the ValueList without it showing on the Chart.
Example
TChart1.Series(0).Add 46, "My hidden value", clNone
Use Series.Delete to delete a point from a Series.
Example
TChart.Series(0).Delete(7) ; (8th point - Points index start at zero)
Point ranges may be deleted from a Series:
Private Sub Command1_Click()
TChart1.Series(0).DeleteRange 5, 5 '(Deletes points 5, 6, 7, 8, & 9 from the Series)
End Sub

Private Sub Form_Load()
With TChart1
    .AddSeries scLine
    .Series(0).FillSampleValues 20
End With
End Sub
See the table Adding data to a Series for a list of Series Types that support the AddNull method. As the name suggests, AddNull will add a Null point to the Series allowing you to define a label for the point but leaving a break in the Series at that point. In the case of a Line Series, the last point before the break will not join to the first point after the break. See Series.AddNull and Series.AddNullXY.
example
TChart1.Series(0).AddNull "my null value"
TeeChart Pro offers an empty Chart Canvas as a backdrop to data Series. That means that no Chart types are predefined. You define the Chart type you require as a mix of the Series Types that you wish to display. Due to the specialised nature of some Series types it is impractical to mix that Series type with another on a Chart. TeeChart helps you by greying out unsuitable Series types in the Chart Gallery when you arrive to add a new Series. There is no practical limit to the number of Series that you can put in one Chart.
Add a Series using the Chart Editor (see Tutorial 1) or by code.
Example
TChart1.AddSeries(scLine) ' Adds a Line Series
(*Note. Microsoft's Implementation of VBScript in internet Explorer does not support the TeeChart Enum constants (scLine, scBar, etc.). You must use the integer equivalent (0,1, etc.) to add a new Series type. See ESeriesClass for a full list. This rule applies to all use of TeeChart ENum constants with VBscript.
Example
TChart1.AddSeries(0) ' Adds a Line Series (vbscript)
See the 'Walk-through VBScript examples')
Series are added to the SeriesList accessible by Index, TChart1.Series(index), beginning with 0 for the first Series. TeeChart Pro adds a default name for the Series (Series1, Series2, etc.). You may modify the name using the Series.Title property.
Series added to the Chart will automatically take the Left and Bottom axes as their reference axes. You may change the reference axes in the Chart Editor by selecting the Series General page for the relevant Series. There are 4 axes available, Top, Left, Bottom and Right. By code, changing the axes will look like this:
With TChart1.Series(0)
 .HorizontalAxis = aTopAxis
 .VerticalAxis = aRightAxis
End With
More than 1 Series may be associated with each Axis. TeeChart will decide the best scale to fit the Series matched to the Axis but you may change Axis scales yourself (See the Axis Tutorial). Additional axes may be added, they will copy the scales associated with their counterpart from the first 4 axes (see the Tutorial section Additional axes).
You may use a Series as the datasource for another Series. This can be done with the Chart Editor by setting the datasource for the 2nd Series. Go to the Series tab, Datasource page. Select 'Function' as the datasource type. Two Listboxes will appear, available Series and Selected Series. Select the Series you wish to use as the datasource for the present Series, then, in the Combobox above, entitled Function:, select Copy as the function type. Note that any Series, in this way, may be defined as a function of any other Series and the Function Type may be any of the list available in the Function combobox. To do the same by code see below:
With TChart1.Series(1)
  .DataSource = "Series1"  '  Series1 es Series(0)
  .SetFunction tfCopy
End With
See tutorial 7 - Working with Functions for more information about how to use TeeChart functions.
Changing series order is very easy with the Chart Editor. Go to the front page of the Editor and highlight the series that you wish to move. Use the arrow buttons on the right to move the Series up or down in the Series order. Series order will decide the relative display position of the Series in the Chart with respect to other Series. Setting a Series to 'Active=False' will hide the Series from the Chart but maintain its data content intact.
To change series order by code use TChart.ExchangeSeries.
TChart1.ExchangeSeries 0, 1 ' Change Series(0) with Series(1) in the index order
*Note. After exchanging Series, the index for the Series will be changed. Thus the line of code above will perpetually interchange the 2 Series '0' and '1' if the code is rerun, as 0 becomes 1 and 1 becomes 0.
TeeChart Series store their values in a Valuelist accessible and modifiable via the ValueList Interface. See the Visual Basic example code entitled "Interactive" below the examples Folder for a working example of the techniques outlined below.
You may access any value in the list:
Example
msgbox TChart1.Series(0).XValues.Value(3)
'Displays value of 4th point (index starts at 0) in Series0
Values accessed in this way may be used to set traps on Series data:
With TChart1.Series(0)
   For t = 0 To .Count - 1
     If .YValues.Value(t) > 900 Then
       MsgBox "Value: " & .XValues.Value(t) & ", " _
              & .YValues.Value(t) & " exceeds limit"
     End If
   Next t
End With
The same value may be obtained via the point ValueIndex used by some Series methods and several Chart events.
Example
Private Sub TChart1_OnClickSeries(ByVal SeriesIndex As Long, ByVal ValueIndex As Long, ByVal Button As TeeChart.EMouseButton, ByVal Shift As TeeChart.EShiftState, ByVal X As Long, ByVal Y As Long)
If SeriesIndex = 0 Then
  MsgBox "ValueIndex is: " & ValueIndex
  MsgBox "Point's Y value is: " & TChart1.Series(SeriesIndex).YValues.Value(ValueIndex)
End If
TChart1.StopMouse  'Use Stopmouse to prevent Zoom event activating
End Sub
This code modifies the value of a BarSeries Bar according to the user's mouseclick. See TeeChart's Interactive Visual Basic demo.
Example
'Use the OnClickSeries or OnclickBackground event to determine where the user has clicked.
Private Sub TChart1_OnClickBackground(ByVal Button As TeeChart.EMouseButton, ByVal Shift As TeeChart.EShiftState, ByVal X As Long, ByVal Y As Long)
If CInt(TChart1.Axis.Bottom.CalcPosPoint(X)) > -1 Then
  Select Case Button
  Case 1
    UpdatePoint CInt(TChart1.Axis.Bottom.CalcPosPoint(X)), CInt(TChart1.Axis.Left.CalcPosPoint(Y))
  End Select
End If
End Sub

Private Sub TChart1_OnClickSeries(ByVal SeriesIndex As Long, ByVal ValueIndex As Long, ByVal Button As TeeChart.EMouseButton, ByVal Shift As TeeChart.EShiftState, ByVal X As Long, ByVal Y As Long)
  UpdatePoint ValueIndex, CInt(TChart1.Axis.Left.CalcPosPoint(Y))
End Sub
In both cases call the UpdatePoint Sub routine to modify the Bar's value:
Private Sub UpdatePoint(Bar, Y As Double)
  If Bar < TChart1.Series(0).Count Then
    TChart1.Series(0).YValues.Value(Bar) = Int(Y)
  End If
End Sub
The previous section introduces some use of Series events. This section shows some additional uses.
You may use the OnClickSeries event to obtain almost any information about a Series (see the section, Accessing Series Values).
'These examples apply to a Series with Datetime data
'eg These test values may be used for the following event examples
Private Sub Command1_Click()
 TChart1.AddSeries scLine
 With TChart1.Series(0)
  .XValues.DateTime = True
  .asLine.Pointer.Visible = True
  .Marks.Visible = True
  'Here with European dateformat
  .AddXY DateValue("1/1/1999") + TimeValue("11:59:00"), 45, "", clTeeColor
  .AddXY DateValue("1/1/1999") + TimeValue("21:59:00"), 23, "", clTeeColor
  .AddXY DateValue("2/1/1999") + TimeValue("11:59:00"), 43, "", clTeeColor
  .AddXY DateValue("2/1/1999") + TimeValue("21:59:00"), 12, "", clTeeColor
  .AddXY DateValue("3/1/1999") + TimeValue("10:59:00"), 12, "", clTeeColor
  .AddXY DateValue("3/1/1999") + TimeValue("21:59:00"), 11, "", clTeeColor
  .AddXY DateValue("4/1/1999") + TimeValue("11:59:00"), 34, "", clTeeColor
  .AddXY DateValue("4/1/1999") + TimeValue("21:59:00"), 15, "", clTeeColor
  .AddXY DateValue("4/1/1999") + TimeValue("23:59:00"), 28, "", clTeeColor
  .AddXY DateValue("5/1/1999") + TimeValue("09:59:00"), 32, "", clTeeColor
  .AddXY DateValue("5/1/1999") + TimeValue("21:59:00"), 32, "", clTeeColor
 End With
 TChart1.Axis.Bottom.SetMinMax TChart1.Series(0).XValues.First, _
                               TChart1.Series(0).XValues.Last + (2 / 12)
End Sub
You could use this event to display Series 'Clicked' values
Private Sub TChart1_OnClickSeries(ByVal SeriesIndex As Long, ByVal ValueIndex As Long, ByVal Button As TeeChart.EMouseButton, ByVal Shift As TeeChart.EShiftState, ByVal X As Long, ByVal Y As Long)
  'The below will show the Value of the nearest Point, not the exact Axis value at the clicked X and Y.
  MsgBox ("Date is:" & Format(TChart1.Series(SeriesIndex).XValues.Value(ValueIndex), "dd/mm/yyyy hh:mm:ss") _
            & " Value is:" & TChart1.Series(SeriesIndex).YValues.Value(ValueIndex))
  TChart1.StopMouse
End Sub
Or alternatively:
Private Sub TChart1_OnClickSeries(ByVal SeriesIndex As Long, ByVal ValueIndex As Long, ByVal Button As TeeChart.EMouseButton, ByVal Shift As TeeChart.EShiftState, ByVal X As Long, ByVal Y As Long)
  'The below will show the exact Axis values at the X,Y clicked.
  MsgBox ("Date is:" & Format(TChart1.Series(SeriesIndex).XScreenToValue(X), "dd/mm/yyyy hh:mm:ss") _
             & " Value is:" & TChart1.Series(SeriesIndex).YScreenToValue(Y))
  TChart1.StopMouse
End Sub
For those Series that use the TChart Pointer, you may access and modify the Pointer using the OnGetSeriesPointer event:
'Drawing an Uptriangle if the Point is higher than the last, DownTriangle if lower, etc.
Private Sub TChart1_OnGetSeriesPointerStyle(ByVal SeriesIndex As Long, ByVal ValueIndex As Long, AStyle As TeeChart.EPointerStyle)
 If ValueIndex > 0 Then
   If TChart1.Series(SeriesIndex).YValues.Value(ValueIndex) > TChart1.Series(SeriesIndex).YValues.Value(ValueIndex - 1) Then
     AStyle = psTriangle
   ElseIf TChart1.Series(SeriesIndex).YValues.Value(ValueIndex) < TChart1.Series(SeriesIndex).YValues.Value(ValueIndex - 1) Then
     AStyle = psDownTriangle
   Else
     AStyle = psDiamond
   End If
 Else
   AStyle = psDiamond
 End If
End Sub
Use the OnGetSeriesMark event to modify the Mark contents at runtime:
This code varies the Marktext according to the value relative to the last Arrow lengths are changed too. TeeChart supports the dragging of Marks in cases of overlapping, see the VB 'Moving Marks' example in the VB examples folder
Private Sub TChart1_OnGetSeriesMark(ByVal SeriesIndex As Long, ByVal ValueIndex As Long, MarkText As String)
 If ValueIndex > 0 Then
   If TChart1.Series(SeriesIndex).YValues.Value(ValueIndex) > TChart1.Series(SeriesIndex).YValues.Value(ValueIndex - 1) Then
     MarkText = MarkText & " (Up)"
   ElseIf TChart1.Series(SeriesIndex).YValues.Value(ValueIndex) < TChart1.Series(SeriesIndex).YValues.Value(ValueIndex - 1) Then
     TChart1.Series(SeriesIndex).Marks.ArrowLength = 5
     MarkText = MarkText & Chr$(13) & "(Down)"
   Else
     TChart1.Series(SeriesIndex).Marks.ArrowLength = 25
     MarkText = MarkText & Chr$(13) & "(No change)"
   End If
 End If
End Sub
An example of the Series events can be seen below:
Private Sub Form_Load()
With TChart1
    .Aspect.View3D = False
    .AddSeries scBar
    .Series(0).FillSampleValues 10
    .Series(0).Marks.Visible = False
End With
End Sub


Private Sub TChart1_OnMouseEnterSeries(ByVal SeriesIndex As Long)
Dim clicked As Long
  clicked = TChart1.Series(SeriesIndex).GetMousePoint

  ' Show Series name and point index and value
  Label1.Caption = "Series: " + TChart1.Series(SeriesIndex).Name + _
                 "  point:" + Str(clicked) + _
                 "  value:" + Str(TChart1.Series(SeriesIndex).YValues.Value(clicked))
End Sub

Private Sub TChart1_OnMouseLeaveSeries(ByVal SeriesIndex As Long)
  Label1.Caption = ""
End Sub
 |
 |