
Previous | Next
|
|
Contents page Previous | Next |
| Contents |
Function Types
Function characteristics |
A TeeChart Pro Function is a Series, that can be of almost any Series Type, to which an algebraic function is applied and for which the datasource is another Chart Series.
All Functions derive from the Teefunction Class and inherit TeeFunction's Period property.
TeeChart Pro offers following list of predefined functions:
|
Function Type |
No. of inputs | Description |
| Standard | ||
| Add | Unlimited | Plots sum of inputs |
| Subtract | Unlimited | Plots value of inputs subtracted in descending order of inclusion |
| Multiply | Unlimited | The Multiply Function plots value of inputs multiplied |
| Divide | Unlimited | The Divide Function plots inputs divided in descending order of inclusion |
| High | Unlimited | The High Function plots high point of inputs |
| Low | Unlimited | The Low Function plots low point of inputs |
| Average | Unlimited | The Average Function will calculate the average of every group of Period points |
| Y=F(X) | None | Draws a user defined function |
| Count | Unlimited | Counts the number of Series Points in the Chart |
| Extended | ||
| Smoothing | 1 | Created a smoothed line joining the points from a given source series |
| Exponential Average | 1 | Exponential average based on Weight |
| Standard Deviation | 1 | Maps the Standard Deviation (or Complete Standard Deviation) of every group of Period points |
| Root Mean Square | 1 | (RMS) Result = Sqrt( Sum( Square(Value) ) ) / NumValues ) |
| Cross Points | Unlimited | Highlights where two Line series cross over each other |
| Peformance | 1 | Percentage change from one series point to the next |
| Curve Fitting | 1 | Draws curve through data inputs using the TypeFitting formula |
| Trend | 1 | Draws best trend line through points of input Series |
| Exponential Trend | 1 | Trend with exponential weighting |
| Cumulative | Unlimited | Constructs a line based on the cumulative values of the input |
| Financial | ||
| ADX | 1 | Financial function. Average Directional Change |
| R.S.I. | 1 | RSI = 100.0 - ( 100.0 / ( 1.0 + Abs( Ups / Downs ) ) ) |
| Moving Average | 1 | The Moving Average Function will calculate the simple or weighted average of every group of Period points |
| Exponential Moving Average | 1 | Uses the following formula: FP = 2 / ( Period + 1 ) |
| Momentum | 1 | Each Y value is the current point's Y value less the last Period point's Y value |
| Momentum Division | 1 | Ratio of value compared to previous 'nth' value |
| MACD | 1 | Financial function. Moving Average Convergence Divergence |
| Stochastic | 1 | Financial function. Calculates the highest and lowest value in a given period |
| Bollinger | 1 | Financial function. Uses Moving average (may be exponential) and standard deviation |
| Compression | 1 | Calculates the highest and lowest value from a source series during a datetime period |
| Closed Location Value | 1 | CLV = ( (Close-Low)-(High-Close))/(High-Low) |
| On Balance Volume | 1 | For each point in the OHLC series, the Close price is compared to the Open price. If the Close is higher, the Volume value for that point is added. If the Close is lower, the Volume value is lowered. |
| Commodity Channel Index | 1 | Financial Indicator used to identify cyclical turns in commodities |
| Volume Oscillator | 1 | Calculates the difference between two exponential moving averages ( a - b) |
Several Function types support only one input Series. However it is possible to chain link Functions, thus, for example, taking the average of several Series in your Chart to create an Average Function Series, then identify the Trend of the average by using the Average Function as the input to the Trend Function.
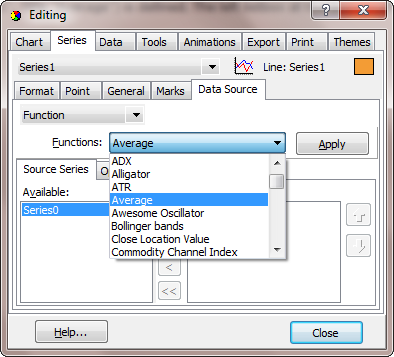
With the Chart Editor, on the First Chart page, select the Add button as if to add a new Series to the Chart. In the TeeChart Gallery choose the Functions tab to select the Function you require. Each Function is presented as a Line Series, you may change the Series Type associated with the Function later by choosing the Change button on the first Chart Page. Function definitions are easily changed afterwards on the Datasource page of the Function Series. Here, just as easily, you may change the definition of a normal Series that you have added to the Chart to that of a Function (Function is really a definition of datasource, not a definition of Series Type).
The image below shows the Datasource page when editing a Function. The Line Series (Name "Series1", Title "Average") is defined. The left listbox at the bottom of the Datasource page shows other Series in the Chart available for input (here "Series0").
Assuming we start with a completely empty Chart here are the steps in code to build a simple Series-Function related Chart.
With TChart1
  'Add 2 data Series
  .AddSeries scBar
  .AddSeries scBar
  ' Populate them with data (here random)
  .Series(0).FillSampleValues 10
  .Series(1).FillSampleValues 10
  ' Add a series to be used for an Average Function
  .AddSeries scLine
  'Define the Function Type for the new Series
  .Series(2).SetFunction tfAverage
  'Define the Datasource for the new Function Series
  'Datasource accepts the Series titles of the other 2 Series
  .Series(2).DataSource = "Series0,Series1"
   '    *Note - When populating your input Series manually you will need to
   '    use the Checkdatasource method
   '    - See the section entitled 'Defining a Datasource'
  'Change the Period of the Function so that it groups averages
  'every 2 Points
  .Series(2).FunctionType.Period = 2
End With
We can add another Function to tell us something about the previous Function
With TChart1
  'Add another Series to be used for a 2nd Function
  .AddSeries scLine
  'Define the Function Type for the new Series
  .Series(3).SetFunction tfHigh
  'Define the Datasource for the new Function Series
  'Use the existing Function (Series2) as input
  .Series(3).DataSource = "Series2"
  'Leave the Period at default 0 (No Period set) to draw
  'A line at Highest of all points of the Average Function
End With
The examples in the previous section highlight the use of Datasource for populating a Function by code. Series use datasource for defining the input for a Function or to define a Series ODBC datasource (see the Tutorial about accessing databases).
Using the Chart Editor, after adding a Function, the Function Series' Datasource page will show a list of available series for inclusion in the function definition. Here you may change the Function Type you wish to apply to the Series and select Series from the Left listBox "Available" and add them to the right Listbox,"Selected".
Datasource by code uses the Series.Datasource property.
Example
Suppose we have 2 data Series in a Chart. We add a Function composed of the average of the 2 Series:
With TChart1
  .AddSeries scLine
  'Define the Function Type for the new Series
  .Series(2).SetFunction tfAverage
  .Series(2).DataSource = "Series0,Series1"
End With
We add points to the 2 Series:
Dim t As Integer
With TChart1
  For t = 0 To 10
    .Series(0).Add 2 * t, "", clTeeColor
    .Series(1).Add 3 * t, "", clTeeColor
  Next t
End With
Notice that the Function doesn't display. You need to use the Series.CheckDatasource method to read in values for the Function.
TChart1.Series(2).CheckDataSource
'Read in data for Function
Function definition may be changed at runtime using the Setfunction method to allocate a new Function to the Series.
TChart1.Series(2).Setfunction tfMovavg
with the above line of code, Setfunction changes the Function for Series(2) to a Moving Average.
Period is an important property for working with Functions as the Period defines the range of points across which a Function is cyclically applied.
Example
We have 6 data points (e.g. bars of a Bar Series) with values:
3, 8, 6, 2, 9 and 12
We define a Function Series with Period 0 (default) the average drawn is:
6.667
With Period set to 2 we get 3 values of average as output from the function:
5.5, 4 and 10.5
These values will plot centrally in their period range, i.e. The 1st value between bars 1 and 2 of the input series, 2nd value between bars 3 and 4, etc..
You may define Period by selecting the relevant Series and Function in the Datasource page and clicking the "Options" tab or you may modify Period at runtime using FunctionType.
E.g. Where Series 2 is the function series:
TChart1.Series(1).FunctionType.Period=2
Below are 2 Charts that highlight the effect of an applied Period
 | 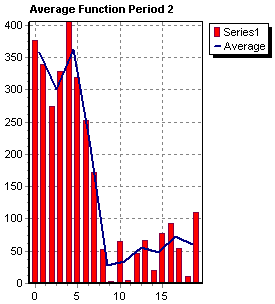 |
Period can be defined to be a range. This is very useful when using Date-Time series and want to express the "Period" of the function in a date-time step like "OneMonth" or "OneDay". The property "PeriodStyle" controls how is "Period" expressed.
For example you can now plot the "monthly average of sales" function just using a normal "Average" function on a date-time source series and setting the function period to "one month":
'Add a Series and fill it with datetime data values at runtime (or from a database)

TChart1.Series(1).SetFunction tfAverage
TChart1.Series(1).FunctionType.PeriodStyle =psRange
TChart1.Series(1).FunctionType.Period = TChart1.GetDateTimeStep dtOneMonth
TChart1.Series(1).DataSource = "Series0"
This will result in several points, each one showing the "average" of each month of data in Series0.
It’s mandatory that points in the source Series0 should be sorted by date when calculating functions on datetime periods.
The range can also be used for non-datetime series:
TChart1.Series(1).SetFunction tfAverage
TChart1.Series(1).FunctionType.PeriodStyle =psRange
TChart1.Series(1).FunctionType.Period=100
TChart1.Series(1).DataSource= "Series0"
This will calculate an average for each group of points inside every "100" interval.
(Points with X >=0, X<100 will be used to calculate the first average, points with X >=100, X<200 will be used to calculate the second average and so on... ).
Notice this is different than calculating an average for every 100 points.
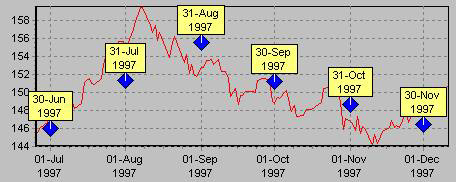
Use the Period Alignment property to align the function Points within the Series range. The following will plot the Function point at the end of a monthly Period:
TChart1.Series(1).FunctionType.PeriodStyle = psRange
TChart1.Series(1).FunctionType.Period = TChart1.GetDateTimeStep dtOneMonth
TChart1.Series(1).FunctionType.PeriodAlign =paLast
As you can see from the picture below, the "average" is plotted at the end of the month.
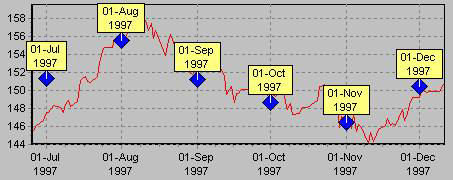
In this case the "average" is plotted at the beginning of the month.
 |
 |