
Previous | Next
|
|
Contents page Previous | Next |
Connecting a TeeChart control to ADO databases can be done at design-time using the Chart Editor and at run-time with few lines of code.
Any Series can be connected to ADO tables or queries using the Chart Editor. Every Series can be connected to the same or different table or query using the same or different ADO database.
This design gives you total flexibility on how do you connect Charts to databases, as you aren't restricted to only one database or to only one table or query.
Data is retrieved also at design-time so you see the actual data during development.
At design-time, the steps necessary to connect a Series to an OLE/ODBC datasource are:

From here you can either select a Data Link (UDL) file or you can build your own Connection String. In this example we'll select the default Microsoft OLE DB Provider for ODBC Drivers from the Provider tab and the TeeChart Pro Database from the Connection tab:


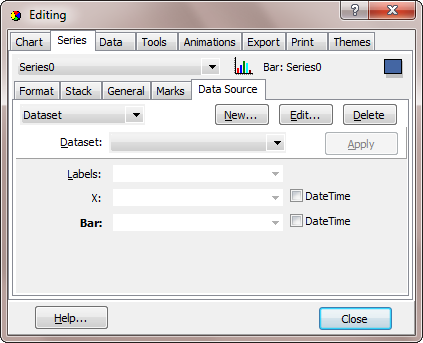
Now you should define which Fields from the Table or SQL Query should be retrieved and added to the Series. This is done with the Chart editor, by selecting the appropriate fields for each Series part.

Each Series has a "Label" field (which should be of type "String" or "Char") ,and a value field (the "Bar" field for Bar Series), which should be of either integer, floating or date-time field type.
In this example, we have selected the "LASTNAME" field from the "Employee" table for the Series labels, and the "SALARY" numeric field for the Bar point values.
See the Dataset combobox in the above picture. This combobox shows the available tables or queries you have created. You can always come to this dialog and select a different dataset, or edit it by clicking the "Edit..." button.
Now we have assigned the appropriate fields, it's time to see the results.
At this time, the TChart control will open the selected ADO database Table or Query, and will start retrieving records and adding values to the selected Series.
In our example, you'll see at design-time the following Chart:
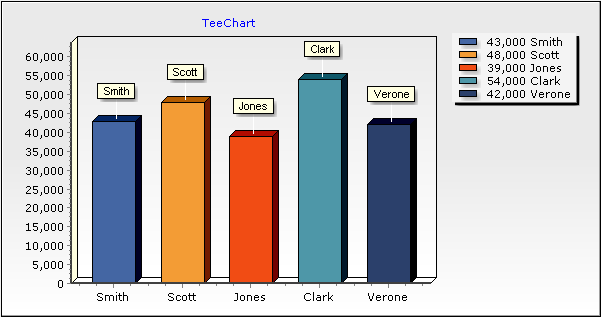
Now, if you run the project, the Chart will retrieve all records from ODBC and will add values to the Series. You will see the same Chart you saw at design-time before running the project.
See also the included ADO examples for Visual Basic under the "Examples" folder.
At design-time, the steps necessary to connect a Series to a single record of an OLE/ODBC datasource are:
From here you can either select a Data Link (UDL) file or you can build your own Connection String. In this example we'll select the default Microsoft OLE DB Provider for ODBC Drivers from the Provider tab and the TeeChart Pro Database from the Connection tab:

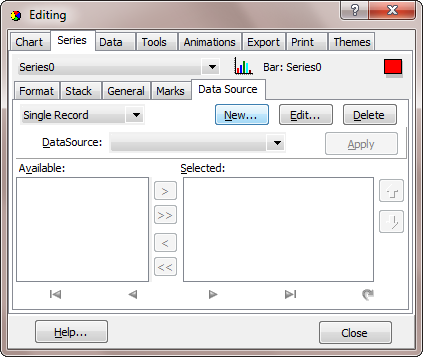
Now you should define which Fields from the Table or SQL Query should be retrieved and added to the Series. This is done with the Chart editor, by selecting the appropriate fields from those available.

In this example, we have selected the all the available fields except the "Year" field.
See the Dataset combobox in the above picture. This combobox shows the available tables or queries you have created. You can always come to this dialog and select a different dataset, edit it by clicking the "Edit..." button or delete it by clicking the "Delete" button.
Now we have assigned the appropriate fields, it's time to see the results.
At this time, the TChart control will open the selected ADO database Table or Query, and will start retrieving records and adding values to the selected Series.
In our example, you'll see at design-time the following Chart:

If you have clicked the "Apply" button rather than the "Close" button and have therefore left the Chart Editor open, you will now be able to navigate through all the records of your DataSet using the navigator buttons on the Data Source page.
Now, if you run the project, the Chart will retrieve all records from ODBC and will add values to the Series. You will see the same Chart you saw at design-time before running the project.
See also the included ADO examples for Visual Basic under the "Examples" folder.
At design-time, the steps necessary to create Series which are summeries of an OLE/ODBC datasource are:
From here you can either select a Data Link (UDL) file or you can build your own Connection String. In this example we'll select the default Microsoft OLE DB Provider for ODBC Drivers from the Provider tab and the TeeChart Pro Database from the Connection tab:

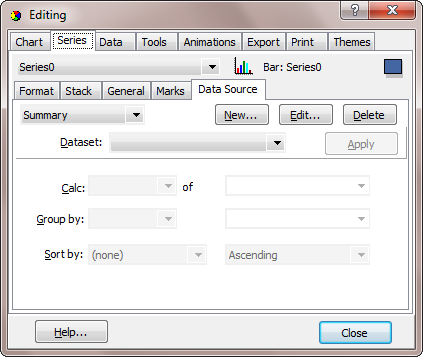
Now you should define which Fields from the Table or SQL Query should be used to create your summary and added to the Series. This is done with the Chart editor, by selecting the appropriate fields from those available.

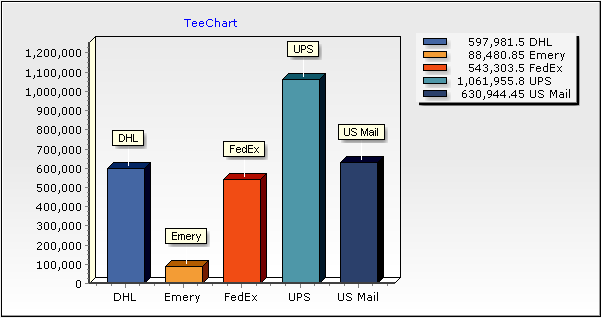
In this example, we have calculated the sum of the ITEMTOTAL field and have grouped the results by the SHIPVIA field.
See the Dataset combobox in the above picture. This combobox shows the available tables or queries you have created. You can always come to this dialog and select a different dataset, edit it by clicking the "Edit..." button or delete it by clicking the "Delete" button.
Now we have assigned the appropriate fields, it's time to see the results.
At this time, the TChart control will open the selected ADO database Table or Query, and will start retrieving records and adding values to the selected Series.
In our example, you'll see at design-time the following Chart:
Now, if you run the project, the Chart will retrieve all records from ODBC and will add values to the Series. You will see the same Chart you saw at design-time before running the project.
See also the included ADO examples for Visual Basic under the "Examples" folder.
The above design-time steps can be reproduced programmatically with few lines of code. This gives you more freedom and control over database operations.
Repeat the first 3 steps above on a new project and a new Form.
Every Series has the "DataSource" property, which determines the origin of database values (the Table or Query), and the "YValues.ValueSource" and "LabelsSource" properties to specify which fields we want to plot.
And the syntax for Series DataSource is:
' This example uses Microsoft OLE DB
' ActiveX Data Objects 1.0 Library.
' This library is located at: MSADO10.DLL

' declare a Connection and RecordSet variables...
Dim Data As New ADODB.Connection
Dim Record As New ADODB.Recordset

Data.Open "TeeChart Pro Database", "", ""
Record.Open "employee", Data, adOpenKeyset

'The Recordset variable can now be set
'directly to the DataSource
TChart1.Series(0).DataSource = Record
The syntax for LabelsSource and YValues.ValueSource properties is:
TChart1.Series(0).YValues.ValueSource = "SALARY"
TChart1.Series(0).LabelsSource = "LASTNAME"
SQL queries become incorporated into the the opening of the Recordset:
Record.Open "select * from [employee] where [Salary] > 42500", Data, adOpenKeyset
It is recommended you set the above properties in that order. First set the DataSource and then the LabelsSource and the YValues.ValueSource properties.
To disconnect a Series from a datasource, you should simply do this:
TChart1.Series(0).DataSource = ""
In case the database values are changed and you want to "refresh" the connection and retrieve the values again, you should do this:
TChart1.Series(0).CheckDataSource
The "CheckDataSource" method will force the Series to retrieve all records again.
All Series have also the "XValues.ValueSource" property. This property is used for XY charting only (when you have an X coordinate for each point).
You may also wish to programmatically link a UDL file as the Datasource of a TeeChart. This can be achieved using the following syntax:
Dim Data As New ADODB.Connection
Dim Record As New ADODB.Recordset

Data.Open "File Name=C:\Program Files\Common Files\System\Ole DB\Data Links\TEECHARTDB.udl"
Record.Open "employee", Data, adOpenKeyset

TChart1.Series(0).DataSource = Record
An error will be raised if TeeChart can not locate the datasource OLE/ODBC DSN, or it can not open the Table or SQL query you specify. Please see the ADO Databases example (\Examples\Visual Basic 6\ADO Databases) for a fully coded project.
The above design-time steps can be reproduced programmatically with few lines of code.
Repeat the first 3 steps above on a new project and a new Form and add an additional four CommandButtons to it.
To code a Series Single Record is relatively simple, differing from the above Series Dataset only in the use of the DataSourceType property and the syntax of the ValueSource property. These differences can be seen in the coded example below:
Dim rst

Private Sub Command1_Click()
  rst.MovePrevious
  CheckKeys
End Sub

Private Sub Command2_Click()
  rst.MoveNext
  CheckKeys
End Sub

Private Sub Command3_Click()
  rst.MoveLast
  CheckKeys
End Sub

Private Sub Command4_Click()
  rst.MoveFirst
  CheckKeys
End Sub

Private Sub Form_Load()
  Set Conn = CreateObject("ADODB.Connection")
  Set rst = CreateObject("ADODB.Recordset")
  Conn.Open "DSN=TeeChart Pro Database"
  rst.Open "select * from months", Conn, 1, 1

  With TChart1.Series(0)
    ' ****************************************************************
    ' The DatasourceType line should be run before the Recordset is
    ' applied to the Series. The default is dstAllRecords so this
    ' method only really needs to be called for Single Record charting.
    ' ****************************************************************
    .DatasourceType = dstSingleRecord
    .DataSource = rst
    .YValues.ValueSource = "Jan;Feb;Mar;Apr;May;Jun;Jul;Aug;Sep;Oct;Nov;Dec"
  End With

  With TChart1.Tools
    .Add tcAnnotate
    .Items(0).asAnnotation.Position = ppLeftTop
  End With

  CheckKeys
End Sub

Private Sub CheckKeys()
  TChart1.RefreshData
  TChart1.Tools.Items(0).asAnnotation.Text = "Year: " & rst!Year
  If rst!Year = "2017" Then
     Command4.Enabled = False
     Command1.Enabled = False
     Command2.Enabled = True
     Command3.Enabled = True
  ElseIf rst!Year = "2000" Then
     Command2.Enabled = False
     Command3.Enabled = False
     Command1.Enabled = True
     Command4.Enabled = True
  Else
     Command4.Enabled = True
     Command1.Enabled = True
     Command2.Enabled = True
     Command3.Enabled = True
  End If
End Sub
For further details on the manipulation of the TeeChart DataSource, ValueSource and LabelSource properties please refer back to the Dataset section of this Tutorial.
The above design-time steps can be reproduced programmatically with few lines of code.
Repeat the first 3 steps above on a new project and a new Form and add an additional two ComboBoxes to it.
To code a Series Summary is relatively simple, differing from the above Series Dataset only in the syntax of the ValueSource property. This difference can be seen in the coded example below:
Private Sub Form_Load()
  Combo1.Text = "ShipVia"
  Combo2.Text = "Sum"
  Combo1.AddItem "EmpNo", 0
  Combo1.AddItem "PaymentM", 1
  Combo1.AddItem "SaleDate", 2
  Combo1.AddItem "ShipVia", 3
  Combo1.AddItem "Terms", 4
  Combo2.AddItem "Sum", 0
  Combo2.AddItem "Count", 1
  Combo2.AddItem "High", 2
  Combo2.AddItem "Low", 3
  Combo2.AddItem "Average", 4
  Set Conn = CreateObject("ADODB.Connection")
  Set rst = CreateObject("ADODB.Recordset")
  Conn.Open "DSN=TeeChart Pro Database"
  rst.Open "select * from orders", Conn, 1, 1

  With TChart1.Series(0)
    .DataSource = rst
    .YValues.ValueSource = "#Sum#AmntPaid"
    .LabelsSource = "ShipVia"
  End With
End Sub

Private Sub Combo1_Change()
  Combo1_Click
End Sub

Private Sub Combo1_Click()
  With TChart1
    Select Case Combo1.ListIndex
      Case 0
        .Series(0).LabelsSource = "EmpNo"
      Case 1
        .Series(0).LabelsSource = "PaymType"
      Case 2
        .Series(0).LabelsSource = "#Year#SaleDate"
      Case 3
        .Series(0).LabelsSource = "ShipVia"
      Case 4
        .Series(0).LabelsSource = "Terms"
    End Select
  End With
End Sub

Private Sub Combo2_Change()
  Combo2_Click
End Sub

Private Sub Combo2_Click()
  With TChart1
    Select Case Combo2.ListIndex
      Case 0
        .Series(0).YValues.ValueSource = "#Sum#AmntPaid"
      Case 1
        .Series(0).YValues.ValueSource = "#Count#AmntPaid"
      Case 2
        .Series(0).YValues.ValueSource = "#High#AmntPaid"
      Case 3
        .Series(0).YValues.ValueSource = "#Low#AmntPaid"
      Case 4
        .Series(0).YValues.ValueSource = "#Avg#AmntPaid"
    End Select
  End With
End Sub
For further details on the manipulation of the TeeChart DataSource, ValueSource and LabelSource properties please refer back to the Dataset section of this Tutorial.
You may connect Datasources via ASP. The Environment.NoPromptDBConnect property should be set to True to support ASP's connection mode. See the Internet Applications tutorial for more about ASP.
 |
 |