
|
Contents page Next |
Tutorial 1 - Getting started
Getting Started - building Charts and populating Data Series
Introduction to building Charts and populating Data Series by code or by Dataset access
Basic Charts can be built and implemented using the Chart Editor with little or no use of code.
The Chart Editor is two Editors in one as the Chart may be thought of as being distinct from its data Series contents.
You may define the Chart appearance, titles, Legend characteristics and 3D aspect without having to include a data Series.
That gives you the freedom to add and remove different data Series types at runtime without having to redefine the whole Chart look and feel.
 Everything comes together to make the final Chart, with Chart axes being the interface between Chart and Series. A Series has data and its values will influence the label characteristics of the Chart axes. The axes appearance, colours, grid frequency and label fonts may all be defined for the Chart before adding data Series. TeeChart will make a best estimate of most values to minimise the need for you to manually define Chart and Series properties. |
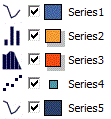
| Add multiple series types with the Chart editor. The "Chart distinct from Series" design paradigm of TeeChart allows you to mix a variety of Series types without being limited to a choice of predefined Chart formats. |
 |
![]()
The steps in this tutorial highlight how easy it is to build a Chart from scratch and will introduce you to the Chart Editor to enable you, through later tutorials, to modify and further enhance the appearance and functionality of the Chart. Good Charting !!
Including TeeChart on a Form
By following the installation instructions for TeeChart you should have succeeded in adding the TeeChart icons to the Delphi Component palette.If your version of Delphi already had the TeeChart Standard version included then you will see no immediate difference when you open Delphi.
You can check that TeeChart is correctly installed by adding a TeeChart to a Form and then, with the Add Series button checking that the Gallery offers you Extended Series Types.
The TeeChart icon is a representation of a circled (Pie) Chart.
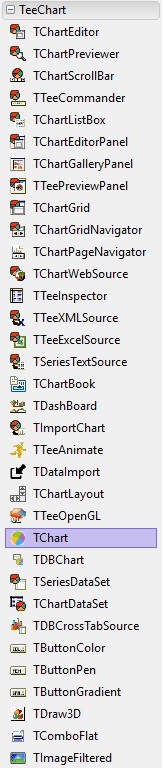
You will find TeeChart, the TChart component, in the TeeChart section of the Delphi Component Palette.
![]()
In addition TeeChart installs one more Chart icon:
TDBChart
|
For a list of other TeeChart installed components follow this link: Non Chart components
Select the first icon of the three and click and drag out to size TChart on a Form.
You will see TChart as a panel with some basic Chart features such as Axis and Title.
TeeChart is derived from a Delphi TPanel, you could use the Chart Editor to delete the existing visual features and you would be left with a perfectly
serviceable 3D panel complete with Border and Bevel properties ! We hope you'll want to use it for more than that though !
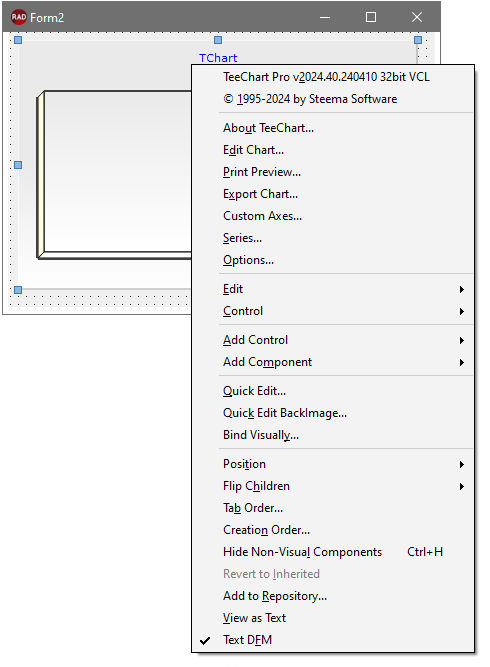
Right click on the new TChart and you will see a menu displayed.
Select the
Edit Chart... option to access the Chart Editor. (Double-mouseclicking on the Chart will achieve the same
aim).
The Chart Editor
The Chart Editor allows you access to most of the commonly used Chart properties.
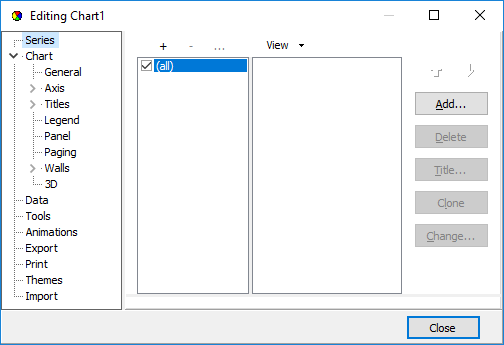
To add a new Series, mouseclick on the Add.. button and select the Series type from the Series Gallery. If after selecting a Series type you wish to change it later you may do so (with a few exceptions where the Series data content may be incompatible) by returning to the first Editor screen and selecting the Change.. button.
The Chart Series Gallery
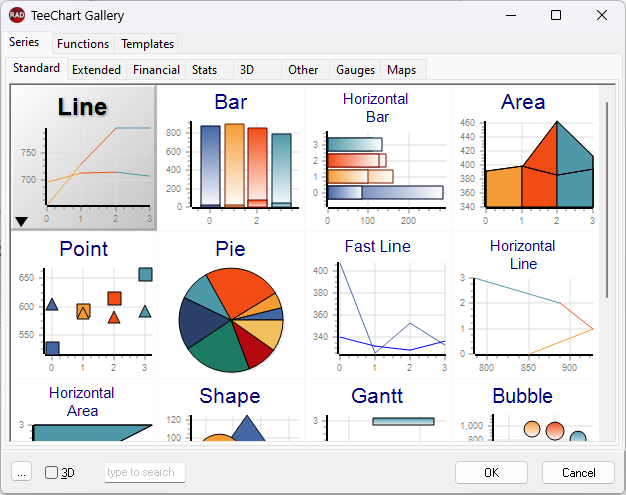
The Gallery consists of eight Series tabbed pages and three Functions tabs:
Series
 Standard Series
Extended Series
Financial Series
Statistical Series
3D Series
Guage Series
Other Series
Map Series
Map Series include a variety of Maps for geographical Charts e.g. World, Europe, North America, Asia, etc.
Functions
Standard
Financial
Extended
Extended functions offer a variety of functions such as those forStatistical applications, Standard Deviation, Root Mean Average, Exponential Trend, etc.
Select a Series type. For this exercise we will choose a Bar Series type. The Gallery will close and the new Series will be displayed in the first Chart Editor screen.
Populate the new data Series
Select the Series tab in the Chart Editor to display the Series configuration properties. The fourth tab on the Series page is the data source tab.Coding data input with TChart
For programmed input of data you will need to write some code. If you are coding data input use TChart rather than TDBChart to avoid having to work with the Borland Database Engine. This section will show you the steps necessary to build a chart with coded input.The Series that you previously added with the Chart Editor shows random data at design time. At runtime however, the Series will be empty of data unless you manually populate it. Select a Command button from the Component palette and place it on your Form. Double-click on the button to access the code editor. In the code Editor type these lines:
With Series1 do
begin
  Add (3, 'Pears', clRed);
  Add (4, 'Apples', clBlue);
  Add (2, 'Oranges', clGreen);
end;
Run the project and press the command button. Three new bars will appear on your Chart. That's it !! There's no more to it.
The Series' Add method accepts 3 variables, Value, Label and Colour. The Add method thus assumes equal spacing of values on the Label axis (in this case the X-Axis). If your data contains 2 variables you may use the AddXY Method. Add another Command button to your project and put this code in it. Run the Project and add points using this code:
  With Series1 do
  begin
    if Count > 0 Then
      //Increment X Axis value and add a new random point
      AddXY (XValues.Last+(Random(100)), (YValues.Last/YValues.Last-1)+(Random(100)), '', clBlue)
    else
      //Add a new random point
      AddXY (1, (Random(100)), '', clBlue);
  end;
Selecting a Series Type to suit your data needs
The last coded example generated new X and Y values. The X axis distance between points may not be constant depending on the values used which may cause overlapping of Bars in some cases, which would be desirable for some but not all applications. Using the Chart Editor to Change the Series type (Enter the Chart Editor at Design time and use the Change button on the first page) to a LineSeries shows an alternative way to graphically represent data with 2 variables. If your data contains more than 2 variables there are other Series Types suited to displaying the data. The following table shows the composition of TeeChart Series types.|
Series Type |
No. of variables |
Datasource Properties |
|
|
||
|
Line |
2 |
XValues, YValues, XLabel |
|
Horizontal Line |
2 |
XValues, YValues, XLabel |
|
Fast Line |
2 |
XValues, YValues, XLabel |
|
Bar |
2 |
XValues, YValues (called Bar), XLabel |
|
HorizBar |
2 |
XValues, YValues (called Bar), XLabel |
|
Area |
2 |
XValues, YValues, XLabel |
|
HorizArea |
2 |
XValues, YValues, XLabel |
|
Point |
2 |
Xvalues, YValues, XLabel |
|
Pie |
1 |
PieValues, XLabel |
|
Arrow |
4 |
StartXValues, StartYValues, XLabel, EndXValues, EndYValues |
|
Bubble |
3 |
Xvalues, YValues, XLabel, RadiusValues |
|
Gantt |
3 |
StartValues, EndValues, AY (Y axis level), AXLabel (Label optionally shown on Y-axis or as mark) |
|
Shape |
4 |
X0 (Top), Y0 (Bottom), X1 (Left), Y1 (Right) |
Accessing datasources with TDBChart
If your data is from a RAD Studio TFDTable or a TFDQuery, or older BDE sets such as a TTable or TQuery then you may map your data directly in the Chart editor.
Place any one of these components on your Form.
TDBChart does not need a Datasource component to access one of these TDataset components.
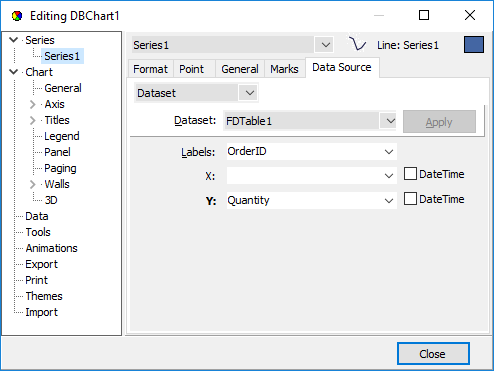
Select Datasource from the dropdown listbox on the Data Source page. The Datasource characteristics fields will activate on the page.
Select the Dataset: Listbox to add a new Data source for the Series.
You may select an existing datasource (TFDTable, TFDQuery, etc) for the Series from
the Datasource drop-down combo box.
When you have selected the datasource TeeChart will automatically populate the Chart with the data it finds in the Dataset.
According to the table above which shows which Series Types require which values, you may add the columns of the Dataset to the 'Labels', X and Y fields. If your data only has Labels and Y values (the X values are index 1, 2 ,3, etc.) you are only required to populate 'Labels' and 'Y' values.
The dataset data will show in design time and when you run the application the data will automatically populate the Chart at runtime.
Non Chart components
TeeChart Pro includes several non-Chart components that may be used to enhance the functionality or appearance of your Charting application. You can find these components in the TeeChart section of the component palette.
Select a button from the following list to see the helpfile description:
 |
 |
 |
 |
© 1996-2024 Steema Software SL. All rights reserved.