
Previous | Next
|
|
Contents page Previous | Next |
| Contents |
Chart display modes
(3D) Chart Editor page |
You may define the major 2D/3D display options with the Chart Editor at design time.
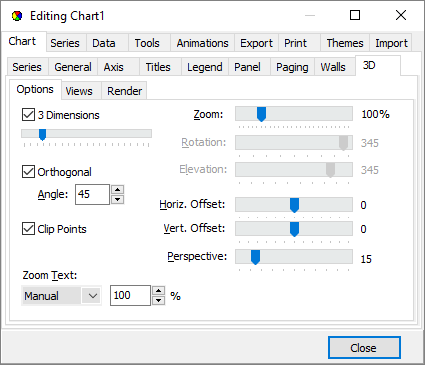
The 2D Chart may be selected at design time using the Chart Editor. Deselecting the 3D checkbox on the Editor page puts the Chart in 2D mode. At runtime you can change the Chart to 2D at any time with:
Chart1.View3D := False;
Working with the 2D Chart presents no special issues. All object co-ordinates relate to their position in relation to the Chart panel or Chart rectangle, there is no need to make any allowance for 3D offset (see following sections).
3D Orthogonal mode is the default way to obtain 3D 'effect'. TeeChart draws depth effect at an orthogonal angle according to the Chart1.Chart3DPercent property setting (also available at design time on the Chart Editor page). You cannot rotate a 3D Orthogonal Chart, the Bottom Axis is always horizontal.
When working with 3D orthogonal Charts you will need to take into account the Width3D and Height3D 3D offset when custom drawing to the Canvas. If you wish an item to be drawn to be flush with the Chart Backwall you should add the offset. See the following examples:
Example
{This example draws a diagonal line across the Chart
flush to the Front of the Chart}
With Chart1, ChartRect do
begin
  //Move the pointer to the top left Chart point
  Canvas.MoveTo(Left,Top);
  //Draw the Line
  Canvas.LineTo(Right,Bottom);
end;

{This example draws a diagonal line across the Chart
flush to the Back of the Chart}
With Chart1, ChartRect do
begin
  //Move the pointer to the top left Chart point
  Canvas.MoveTo(Left + Width3D,Top - Height3D);
  //Draw the Line + adjustment for 3D displacement
  Canvas.LineTo(Right + Width3D,Bottom - Height3D);
end;
Use the TView3DOptions component when working with display properties for 3D Charts at runtime (*Note. Not all options are available for Orthogonal Charts).
TeeChart Pro version 6's view options include "Native" Windows mode 3D. This 3D mode offers many of the display advantages obtainable with OpenGL but is faster. Native Windows mode 3D offers Chart rotation and elevation through 90º. You may Zoom in and out on the overall Chart (Zoom within the Chart is available too, see the Zoom/Scroll tutorial).
Select Native Windows mode 3D for TeeChart at design time by deselecting the Orthogonal checkbox on the 3D Editor page.
//Runtime
Chart1.View3DOptions.Orthogonal := False;
With the Chart Editor, desactivating Orthogonal will simultaneously activate the slide bars for TView3DOptions.Elevation and TView3DOptions.Rotation allowing design time changes for these display properties.
For a closer look at the definition of the TeeChart Canvases look at the Custom drawing tutorial.
You can convert the 3D Chart to an OpenGL Chart by using the TTeeOpenGL non-visual component found in the TeeChart section of the Delphi component palette.

Add the component to the Form in which you have placed a TChart, TDBChart or TQRChart. At design time you may use the Object browser to connect the component to the Chart. At runtime use the following properties:
TeeOpenGL1.TeePanel := Chart1;
TeeOpenGL1.Active := True;
You will see the Chart immediately convert to OpenGL at runtime or design time.
For a closer look at the definition of the TeeChart Canvases look at the Custom drawing tutorial.
 |
 |