
Previous | Next
|
|
Contents page Previous | Next |
| Contents |
IntroductionChart FormatsStatic image formatsOutput data formats Input data formats
TChartWebSource TSeriesTextSource Web Server applicationsWriting ISAPI applications |
TeeChart Pro VCL version offers new functionality to ease the design of Internet/Intranet Charting applications. See the Examples folder for more examples on the following topics.
See the Export Tutorial for more information about Chart Export formats. TeeChart offers several static image export formats for web pages, JPEG, GIF, PNG and WMF (suitable for IE only).
See the Exporting and importing Charts tutorial for more information about Chart export formats.
Example. TeeChart can be exported as a JPEG image to be linked into a web page. See the JPEG section in the Export/Import tutorial for a closer look at the code required to Export the Chart in JPEG format. The chart can be accessed on the webpage via a standard image link.
Example<img src="http://www.myserver.here/tempCharts/myJPEGChart.jpg">
JPEG Charts do not offer the advantages of a "live" Chart, such as mouse clicks, real-time animation, scrolling, etc, but they work with almost any browser.
See the Exporting and importing Charts tutorial for more about importing and exporting data to the Chart. Chart data may be exported as Text, XML, Excel spreadsheet, or as an HTML table.
Text source file, csv delimited:
  Fruit,Qty,Price/Kilo
  Apples,1,76
  Pears,2,45
  Bananas,3,66
  Oranges,4,41
  Kiwis,5,55
The TSeriesTextSource component recognises the Series type of the associated TeeChart Series and offers the relevant field structure for the definition of the source, here a BarSeries:
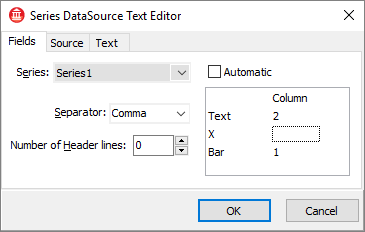
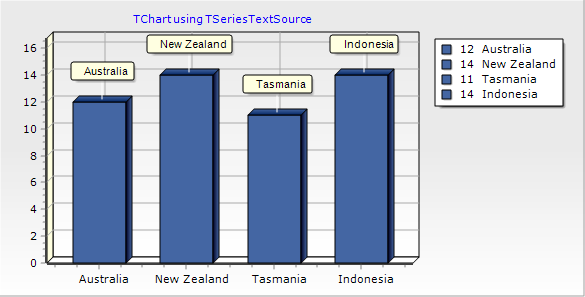
Set the header columns to the number of header text rows from which you don't want the SeriesTextSource to take data. Setting the TSeriesTextSource Active to True loads the Series data. The result for the above data is the following Chart:
The above can be achieved by code in the following way:
procedure TForm1.BitBtn1Click(Sender: TObject);
begin
 With SeriesTextSource1 do
 Begin
   Series:=Series1;
   Filename:='http://www.steema.com/test.txt';
   Headerlines:=1;
   SeriesTextSource1.AddField('Bar',3);
   {Use the keyword 'Text' to select the Label field}
   SeriesTextSource1.AddField('Text',1);
   Active:=True;
 end;
end;
For the Bar Series example above, the word 'Bar' is used to define the Y value. The name is not important when only one data variable is added for the BarSeries as TeeChart will assume that it is the Y value. In the case of the Label field, it must use the title 'Text' (constant Teemsg_Text) to identify it. When multiple Values are added (as if AddXY or for a Candle Series with Date, Open, High, Low, Close) then you could obtain the correct names via the Series ValueList name.
Example:
Consider the following data file:
Date,Open,High,Low,Close
1/1/2000,15,76,7,40
2/1/2000,40,55,35,37
3/1/2000,37,61,29,43
{The following code extracts the data and adds it to the Series}
procedure TForm1.Button1Click(Sender: TObject);
var colcount: integer;
begin
 With SeriesTextSource1 do
 Begin
   Series:=Series1;
   Filename:='c:\tempdata\testcandledata.txt';
   Headerlines:=1;
   For colcount:=0 to Series1.ValuesList.Count-1 do
   begin
     SeriesTextSource1.AddField(Series1.ValuesList[colcount].Name,colcount+1);
   end;
   Active:=True;
 end;
end;
To create a new ActiveForm application select 'New','Activex','ActiveForm' from the File menu in Delphi's IDE. A TChart may be placed on the Form and properties may be added to the Form to perform TeeChart actions.
To insert in Internet Explorer or other ActiveX aware browser you should note the CLSID number of your new ActiveXForm and insert it on the page with syntax similar to the following example:
<OBJECT
   id="TeeVCLAX1"
   type="application/x-oleobject"
   hspace="0"
   vspace="0"
   codebase="TeeChartAXFormExample.ocx#version=1,0,0,1""
   CLASSID="CLSID:6C03C4DE-C883-4B1E-AA11-996319F91A8F">
</OBJECT>
You can add properties and methods to the Activeform object to give runtime functionality to the Chart. For example for the Chart above we added the 'Gradient.Visible' property to enable/disable the Panel Gradient behind the Chart. Press this button to see how it changes the Chart:
The procedure may be invoked by adding a button to the HTML page.
Example
<INPUT TYPE=submit VALUE="Example: Toggle Back Panel Gradient using VBScript" NAME="cdmChartColor" onClick="ToggleGradient()">How to add a TeeChart property to ActiveForm with Delphi
Follow these steps to add a Chart property to an ActiveForm project:
function TTeeVCLAX.Get_Gradient: WordBool;
begin
  result:=Chart1.Gradient.Visible;
end;

procedure TTeeVCLAX.Set_Gradient(Value: WordBool);
begin
  Chart1.Gradient.Visible:=Value;
end;
Compiling the modified project now gives you access to this property with a browser scripting language such as VBScript. The VBScript code listed below is used for the button in this example:
<SCRIPT LANGUAGE="VBScript">
SUB ToggleGradient
        if TeeVCLAX1.Gradient = 0 then
          TeeVCLAX1.Gradient = 1   'replace TRUE/FALSE with numeric equivalents
        else
          TeeVCLAX1.Gradient = 0
        end if
END SUB
</SCRIPT>
<INPUT TYPE=BUTTON VALUE="Example: Toggle Back Panel Gradient using VBScript" NAME="cdmChartColor" onClick="ToggleGradient">
For this type of Charting application you may find the LoadChartFromURL method useful as it permits a means of distributing centrally modified Charts. A timer could be placed on the ActiveForm application to call a periodically updated, server based Chart thus guaranteeing that the browser Chart data is current.
Delphi makes writing ISAPI applications very easy. See the TeeChart ISAPI example in the TeeChart Examples folder for a demonstration of a basic Charting application. A section is included below to show how the Chart is sent to the page in Stream format.
{ This event is created at design-time, double-clicking the WebModule
  form and adding an action... }
procedure TWebModule1.WebModule1WebActionItem1Action(Sender: TObject;
  Request: TWebRequest; Response: TWebResponse; var Handled: Boolean);
Var Stream:TMemoryStream;
begin
  With TForm2.Create(Self) do { create the Form where is the Chart1... }
  try
    //See the ISAPI demo for a full listing of the code that creates the Chart
    //taking parameters from a Web Form as input.
    With ChartToJPEG(Request) do { convert Chart1 to JPEG Function in UnitChart Unit}
    try
      Stream:=TMemoryStream.Create;  { create a temporary stream in memory... }
      try
        SaveToStream(Stream); { save the jpeg to the stream... }
        Stream.Position := 0;
        Response.ContentType:='image/jpeg';   { send the stream... }
        Response.ContentStream:=Stream;
        Response.SendResponse;
      finally
        Stream.Free;  { release the temporary stream... }
      end;
    finally
      Free;  { <-- free the temporary JPEG object returned by ChartToJPEG }
    end;
  finally
    Free; { free the Form2 }
  end;
end;
 |
 |