 |
We have a TChart on the form and have added a Series to it. We are ready to populate the Series.
Let’s type some Delphi code to add points values programmatically.
We'll see later how to create a database-aware Chart with automatic record retrieval.
Example Pie-Series
Suppose the Series we added was a Pie Series. We could populate the Series in the following way. For the following code to work we should leave the Series name as its default of Series1.
Place a TButton on your Form and go to the OnClick event .
Copy the following code at the Button1.OnClick event:
With Series1 do
Begin
    Add(  40, 'Pencil' , clRed ) ;
    Add(  60, 'Paper',  clBlue ) ;
    Add(  30, 'Ribbon', clGreen ) ;
end;
A description of the Add method and other available methods and properties is available at design time via the context sensitive help included with TeeChart. Place the cursor on the word Add in your code and press F1 for a full description of the method.
Return to your code and press F9 again to run the project.
Press Button1 to see the Pie Chart appear - the code works!
Editing the Series
Close the program to go back to Delphi’s IDE.
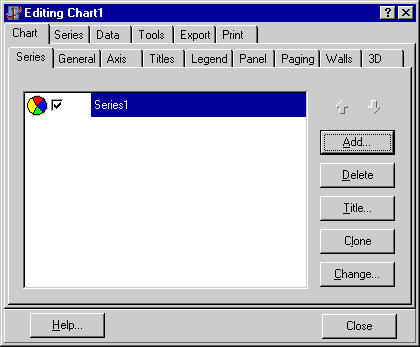
In design mode, all Chart and Series properties are accessible through the Delphi Object Inspector or by right-clicking the Chart and selecting the ‘Edit Chart’ option or double-clicking on the part of the Chart that you wish to edit. Here we’ll use the Chart editor to edit our new Chart and Series. Fig.5. Shows the first editor screen.
To edit features of the Series we can double-click on the Series in the list or highlight the Series and select Edit or directly select the tab for the Series - each technique will take us to the editor for the Series.
| Width1Width3Width1418Width3Width5883Fig. 5.
The Chart Editor screen showing the new Pie Series |

Width1Width3Width1418Width3Width5883 |
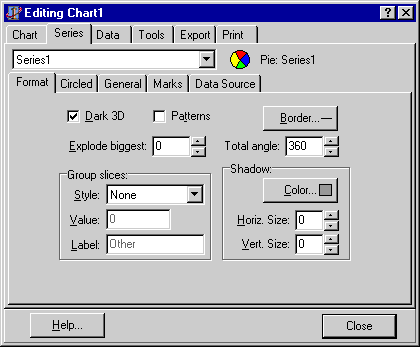
Try changing some properties of the Pie Series; you will see the results update automatically on the Chart. There is no cancel to undo changes but most parameters are easily toggled. Remember, in design time the TChart component hasn’t yet run your code so it shows the randomly generated set of data. You will need to start your project to see how the new parameters show up with your own data.
| Width1Width3Width1418Width3Width5741Fig. 6.
The Chart Editor Series page showing editor tab for our Pie Series |

Width1Width3Width1418Width3Width5741 |
Many changes can be made visually in the editor, or try modifying some parameters in Object Inspector, or modifying a property with your own code. For more advanced projects, you’ll most likely find yourself typing some Object Pascal code.
For a recap and further look at adding data to a TChart via another example, see How To Create Charts with manually inserted values
Now we’ll take a closer look at adding data to the TDBChart component.