 |
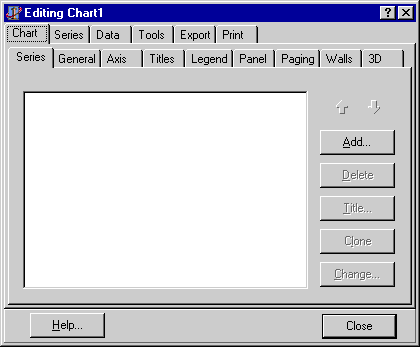
| Fig. 2.
The Chart Editor screen |

|
The Chart page (1st page) of the Chart editor contains definition information for the Chart. It includes sections to define general and other more specific, Chart parameters. Some parameters won’t apply until you have some data Series defined in the Chart. Try modifying a parameter, the Title for example, and you will see it update in real time on the Chart.
To access the Chart editor double-click on any TChart or TDBChart component placed on a Form. Alternatively right mouse-click on the TChart to bring up a menu which includes Chart editor as one of the options.
To edit a TQRChart you may follow the same procedure as above whilst the TQRChart is placed on a QuSoft QuickReport.
See the user guide for more information about the Chart Editor.
To see some data Charted we need to create a data Series...
Add a data Series
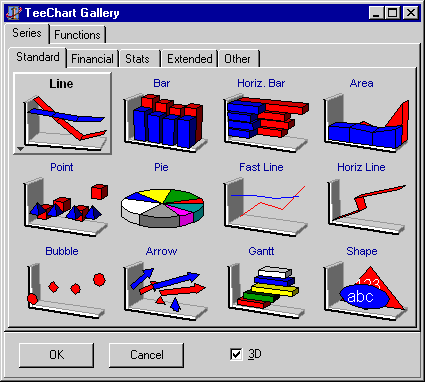
Press the Add button in the Series tab section of the Chart page. TeeChart will show you a gallery of Series types. Select one to add to your Chart, you can change its type later if you decide that you would prefer to visualise your data in a different way.
| Width1Width3Width1488Width3Width6804Fig. 3.
The Chart Gallery |
 Width1Width3Width1488Width3Width6804 Width1Width3Width1488Width3Width6804 |
| Width1Width3Width1488Width3Width6804 |
Select a Series type by mouse or with arrow keys and press ‘OK’. Double-clicking on the Series type will achieve the same result. The Extended Series page is only available in the Gallery with TeeChart Pro.
The Series type is automatically added to your Chart. In the Chart editor you will see a new configuration tab added for the new Series.
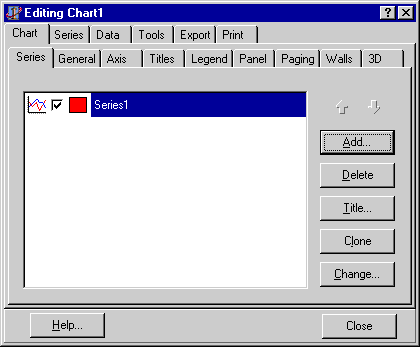
Suppose we had selected a line Series. The editor will appear as follows:
| Width1Width3Width1486Width3Width6945Fig. 4.
New Series added to Chart |
 Width1Width3Width1486Width3Width6945 Width1Width3Width1486Width3Width6945 |
| Width1Width3Width1486Width3Width6945 |
TeeChart has added the Series to the Chart. It has also added some random values so that you can visualise, in the Chart, the Series appearance at design-time to easily follow any changes you are making.
Press the F9 key to compile your project. The project should compile to show you an empty Chart. The random values don’t work at runtime so the next step is to go back to the Chart Editor and add a data source or write your own code to add data values.
Edit the Series
Selecting the Series tab allows you to edit your Series. The next step is to add data to the Series. The steps necessary to include the data for the Series vary slightly between a TChart component and a TDBChart component. See the following 2 sections:
Configuring data Series in a TChart.
and