Tutorial 6 - Working with Series
Contents
Series Types Series Class structure
Choosing a Series Type
Adding data to a Series
Deleting data points from a Series
Adding Null points to a Series
Mixing Series Types on a Chart
Adding New Series
Choose Axes for a Series
Connecting Series
Changing Series order
Series Value list
Accessing Series Values
Example using Values
Series events
OnClickSeries
OnGetSeriesPointerStyle
OnGetSeriesMark
Series Types
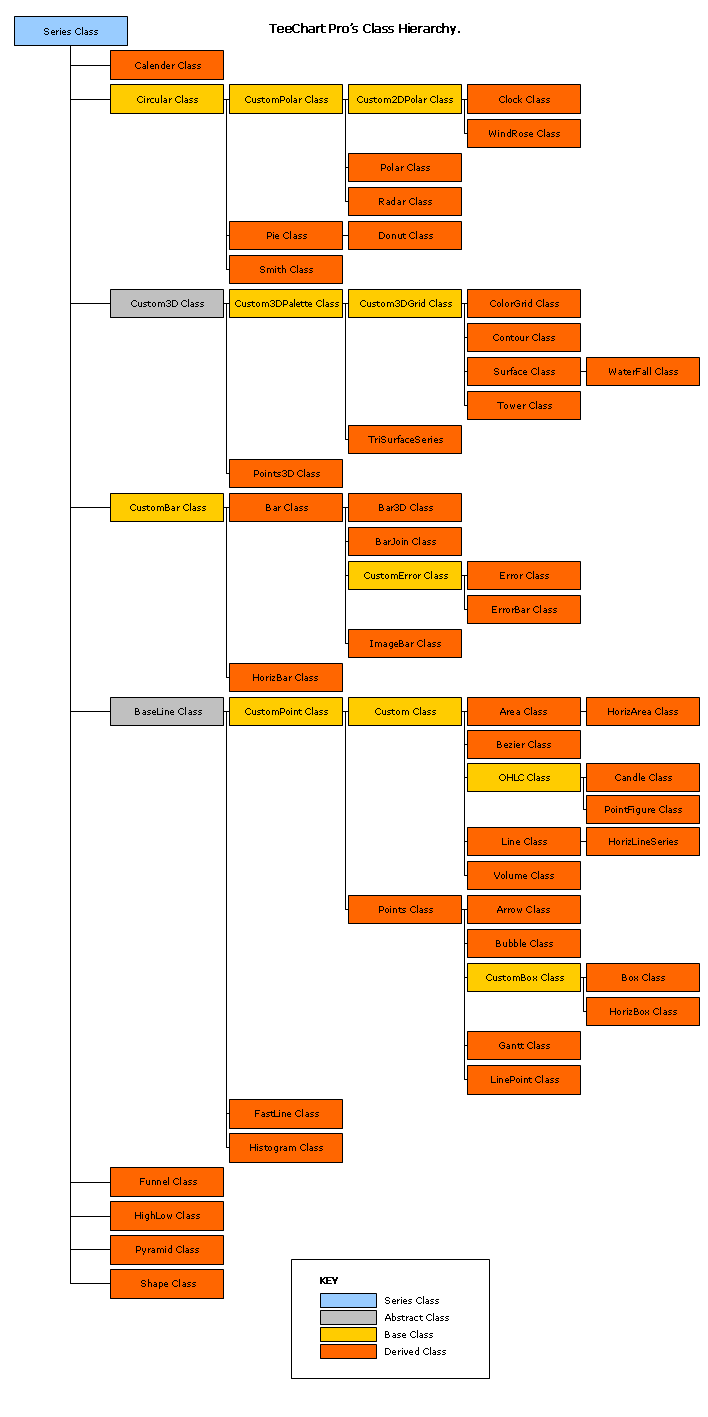
The TChart Series class is the common ancestor for all Series types. When using the TeeChart online help to obtain help on any Series Type, follow the link to the Series class located in the list of inherited types and then click on Series members where a list of all inherited properties and methods will be included. Series Class structure
As a little background on the structure of the TeeChart Type Library, here is an explanation of the Series classes and interfaces. The diagram below shows the relationship between TeeChart Series classes. All classes derive from the generic "Series" class and thus share "Series" properties and methods. Several abstract Classes derive from Series (Custom3DSeries, CustomBarSeries and CircledSeries), these are highlighted in grey and their interfaces are not directly accessible for programming, their characteristics are inherited by their descendant Series types. All derived Series (in orange) are accessible in the TeeChart gallery for inclusion in your Chart. TeeChart Series, derived in this way, allow programmable access to the inherited properties and methods via a common index structure (see example code later in this section).
It's easier to use the TChart Editor to add Series at designtime but you can also create and add new and differing series types to the same TChart at runtime.
[C#]
//Add a series at runtime
private void button1_Click(object sender, System.EventArgs e)
        {
            Steema.TeeChart.Styles.Area tmpAreaSeries = new Steema.TeeChart.Styles.Area(tChart1.Chart);
            tmpAreaSeries.FillSampleValues(4);
            //Or
            //Steema.TeeChart.Styles.Area tmpAreaSeries = new Steema.TeeChart.Styles.Area();
            //tChart1.Series.Add(tmpAreaSeries);
            //tmpAreaSeries.FillSampleValues(4);
        }

[VB.Net]
'Add a series at runtime
Private Sub Button1_Click(ByVal sender As System.Object, ByVal e As System.EventArgs) Handles Button1.Click
         Dim tmpAreaSeries As New Steema.TeeChart.Styles.Area(TChart1.Chart)
        tmpAreaSeries.FillSampleValues(4)
        'Or
        'Dim tmpAreaSeries As New Steema.TeeChart.Styles.Area()
        'TChart1.Series.Add(tmpAreaSeries)
        'tmpAreaSeries.FillSampleValues(4)
End Sub
All AreaSeries properties and methods are available for the new Series as for any Series created at design time.
An example of mixing different series classes in the same Chart would be to add a Area (Series(0)), Bar (Series(1)) and Line (Series(2)) Series to a Chart using the TeeChart Editor at design time. All access a common index structure, the Chart's Series list. To work with the Series may look something like the below:
[C#]
private void Form1_Load(object sender, System.EventArgs e)
        {
            //You could add the Series at runtime
            Steema.TeeChart.Styles.Area area1 = new Steema.TeeChart.Styles.Area(tChart1.Chart);
            Steema.TeeChart.Styles.Bar bar1 = new Steema.TeeChart.Styles.Bar(tChart1.Chart);
            Steema.TeeChart.Styles.Line line1 = new Steema.TeeChart.Styles.Line(tChart1.Chart);

            //Use Series common properties
            tChart1.Series[0].FillSampleValues(10);
            tChart1.Series[1].FillSampleValues(10);
            tChart1.Series[2].FillSampleValues(10);
            tChart1.Series[1].Marks.Visible = false;
            tChart1.Series[2].Marks.Visible = false;

            //Modify Bar specific properties
            bar1.BarStyle = Steema.TeeChart.Styles.BarStyles.Pyramid; //Change Bar type
            bar1.Pen.Color = Color.Yellow; //Bar bounding lines colour

            //Modify Line specific properties
            line1.Stairs = true; //Set line to Stairs
            line1.LinePen.Color = Color.Blue; //LineSeries bounding lines colour

            //Modify Area specific properties
            area1.AreaBrush.Style = System.Drawing.Drawing2D.HatchStyle.Cross; //Area fill pattern
        }

[VB.Net]
Private Sub Form1_Load(ByVal sender As System.Object, ByVal e As System.EventArgs) Handles MyBase.Load
        'You could add the Series at runtime
        Dim Area1 As New Steema.TeeChart.Styles.Area(TChart1.Chart)
        Dim Bar1 As New Steema.TeeChart.Styles.Bar(TChart1.Chart)
        Dim Line1 As New Steema.TeeChart.Styles.Line(TChart1.Chart)

        'Use Series common properties
        TChart1.Series(0).FillSampleValues(10)
        TChart1.Series(1).FillSampleValues(10)
        TChart1.Series(2).FillSampleValues(10)
        TChart1.Series(1).Marks.Visible = False
        TChart1.Series(2).Marks.Visible = False

        'Modify Bar specific properties
        Bar1.BarStyle = Steema.TeeChart.Styles.BarStyles.Pyramid 'Change Bar type
        Bar1.Pen.Color = Color.Yellow 'Bar bounding lines colour

        'Modify Line specific properties
        Line1.Stairs = True 'Set line to Stairs
        Line1.LinePen.Color = Color.Blue 'LineSeries bounding lines colour

        'Modify Area specific properties
        Area1.AreaBrush.Style = System.Drawing.Drawing2D.HatchStyle.Cross 'Area fill pattern
End Sub
Choosing a Series Type
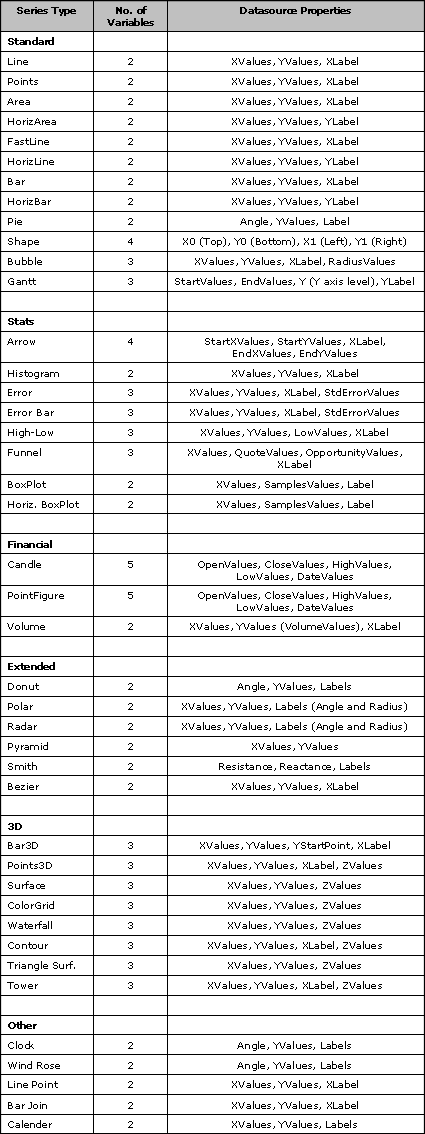
Choosing a Series Type for a Chart will very much depend on your own requirements for the Chart. There are occasions however, when due to the number of variables to plot, the choice of Chart may depend on which Series types support the number of input variables. The following table shows the number of variables allowed by each Series type.
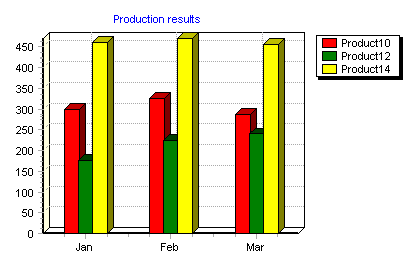
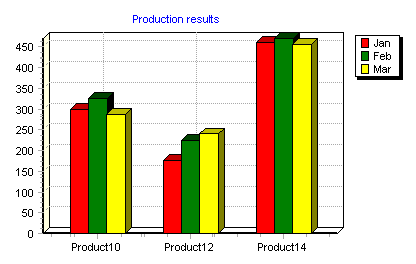
Labelling can be used to extend the value of a 2 variable Series Type. See the example below that uses 3 instances of the Bar Series type in the same Chart.
Example
Uses Bar Series types
Product code Month Quantity produced
10 Jan 300
10 Feb 325
10 Mar 287
12 Jan 175
12 Feb 223
12 Mar 241
14 Jan 461
14 Feb 470
14 Mar 455
In its simplest form, the data produces the following Chart, grouping the information by month:
Code:
[C#]
foreach(Steema.TeeChart.Styles.Series tSeries in tChart1.Series)
{tSeries.Marks.Visible = false;}
tChart1.Header.Text = "Production results";

bar1.Add(300,"Jan");
bar1.Add(325,"Feb");
bar1.Add(287,"Mar");
bar1.Title = "Product10";

bar2.Add(175,"Jan");
bar2.Add(223,"Feb");
bar2.Add(241,"Mar");
bar2.Title = "Product12";

bar3.Add(461,"Jan");
bar3.Add(470,"Feb");
bar3.Add(455,"Mar");
bar3.Title = "Product14";

[VB.Net]
Dim TSeries As Steema.TeeChart.Styles.Series
For Each TSeries In TChart1.Series
    TSeries.Marks.Visible = False
Next
TChart1.Header.Text = "Production results"

Bar1.Add(300, "Jan")
Bar1.Add(325, "Feb")
Bar1.Add(287, "Mar")
Bar1.Title = "Product10"

Bar2.Add(175, "Jan")
Bar2.Add(223, "Feb")
Bar2.Add(241, "Mar")
Bar2.Title = "Product12"

Bar3.Add(461, "Jan")
Bar3.Add(470, "Feb")
Bar3.Add(455, "Mar")
Bar3.Title = "Product14"
or (grouping by product):
Code:
[C#]
foreach(Steema.TeeChart.Styles.Series tSeries in tChart1.Series)
{tSeries.Marks.Visible = false;}
tChart1.Header.Text = "Production results";

bar1.Add(300,"Product10");
bar1.Add(175,"Product12");
bar1.Add(461,"Product14");
bar1.Title = "Jan";

bar2.Add(325,"Product10");
bar2.Add(223,"Product12");
bar2.Add(470,"Product14");
bar2.Title = "Feb";

bar3.Add(287,"Product10");
bar3.Add(241,"Product12");
bar3.Add(455,"Product14");
bar3.Title = "Mar";

[VB.Net]
Dim TSeries As Steema.TeeChart.Styles.Series
For Each TSeries In TChart1.Series
    TSeries.Marks.Visible = False
Next
TChart1.Header.Text = "Production results"

Bar1.Add(300, "Product10")
Bar1.Add(175, "Product12")
Bar1.Add(461, "Product14")
Bar1.Title = "Jan"

Bar2.Add(325, "Product10")
Bar2.Add(223, "Product12")
Bar2.Add(470, "Product14")
Bar2.Title = "Feb"

Bar3.Add(287, "Product10")
Bar3.Add(241, "Product12")
Bar3.Add(455, "Product14")
Bar3.Title = "Mar"
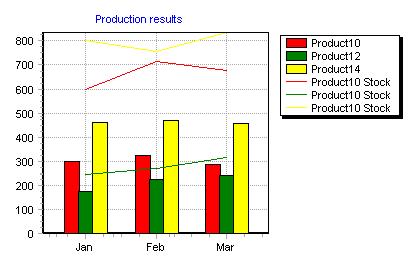
We have added new values to the table above (Stock).
Product code Month Quantity produced Stock level
10 Jan 300 600
10 Feb 325 715
10 Mar 287 676
12 Jan 175 245
12 Feb 223 270
12 Mar 241 315
14 Jan 461 800
14 Feb 470 755
14 Mar 455 835
The values of stock in the table are generally higher than those of monthly production so displaying them gives the following chart (2D this time). The Chart uses Line Series to differentiate Stocks.
Code:
Add the following to the code of the first of the previous examples:
[C#]
line1.Add(600,"Jan");
line1.Add(715,"Feb");
line1.Add(676,"Mar");
line1.Title = "Product10 Stock";
line1.Color = bar1.Color;

line2.Add(245,"Jan");
line2.Add(270,"Feb");
line2.Add(315,"Mar");
line2.Title = "Product10 Stock";
line2.Color = bar2.Color;

line3.Add(800,"Jan");
line3.Add(755,"Feb");
line3.Add(835,"Mar");
line3.Title = "Product10 Stock";
line3.Color = bar3.Color;

[VB.Net]
Line1.Add(600, "Jan")
Line1.Add(715, "Feb")
Line1.Add(676, "Mar")
Line1.Title = "Product10 Stock"
Line1.Color = Bar1.Color

Line2.Add(245, "Jan")
Line2.Add(270, "Feb")
Line2.Add(315, "Mar")
Line2.Title = "Product10 Stock"
Line2.Color = Bar2.Color

Line3.Add(800, "Jan")
Line3.Add(755, "Feb")
Line3.Add(835, "Mar")
Line3.Title = "Product10 Stock"
Line3.Color = Bar3.Color
Adding data to a Series
Most Series types (other than ADO.NET datasources Tutorial 8 and Functions Tutorial 7) use the 24 generic overloads of the Add method for adding data. There are some exceptions, see the following table:

Note that all the Series specific Add methods, with the exception of the ShapeSeries, are automatically added as further overloads to the generic Add method and so are accessed from there (e.g. candleSeries1.Add(new DateTime(2002,11,27),100,400,200,300);).
Colour
Colour may be manually added for a point when adding the point
Example
[C#]
bar1.Add(50,"Tomatoes",Color.Tomato);
[VB.Net]
Bar1.Add(50, "Tomatoes", Color.Tomato)
Alternatively, you can allow TeeChart to allocate a colour. TeeChart will choose one of up to 19 unique and as yet unused colours for each new Series, or for each new Series point if Series.ColorEach = True.
Example
[C#]
Random rnd = new Random();
bar1.ColorEach = true;
for(int i = 0; i < 19; ++i)
{
     int higher = i + 65;
     char letter = (char) higher;
     bar1.Add(rnd.Next(100),letter.ToString());
}
[VB.Net]
Dim i As Integer
Bar1.ColorEach = True
For i = 0 To 19
    Bar1.Add(Rnd() * 100, Chr(i + 65))
Next
A transparent colour may be added to a Point to reserve a space for the value in the ValueList without it showing on the Chart.
Example
[C#]
bar1.Add(45, "My Transparent Bar", Color.Transparent);
[VB.Net]
Bar1.Add(45, "My Transparent Bar", Color.Transparent)
Deleting data points from a Series
Use Series.Delete to delete a point from a Series. Series.Delete has two overloads:
public Void Delete(System.Int32)Deletes the nth point in the Series.
Deletes a number of points n starting from the nth point in the Series.
public Void Delete(System.Int32, System.Int32)
Example
[C#]Series.Clear clears all points from a Series.
bar1.Delete(7,2); (deletes two points starting from the 8th Series point (index starts at zero))
[VB.Net]
Bar1.Delete(7, 2) (deletes two points starting from the 8th Series point (index starts at zero))
Adding Null points to a Series
Series.Add has three overloads which allow you to add a Null point to a Series:
Adds a new null (transparent) point.
public Int32 Add()
Adds a new null point with specified text.
public Int32 Add(System.String)
Adds a new null point at a specified x value with specified text
public Int32 Add(System.Double, System.String)
The second of the above overloads will add a Null point to the Series allowing you to define a label for the point but leaving a break in the Series at that point. In the case of a Line Series, the last point before the break will not join to the first point after the break.
Example
[C#]Please look up the other two overloads in the TeeChart Help File for examples of their use.
line1.Add("Null Point");
[VB.Net]
Line1.Add("Null Point")
Mixing Series Types on a Chart
TeeChart Pro offers an empty Chart Canvas as a backdrop to data Series. That means that no Chart types are predefined. You define the Chart type you require as a mix of the Series Types that you wish to display. Due to the specialised nature of some Series types it is impractical to mix that Series type with another on a Chart. TeeChart helps you by greying out unsuitable Series types in the Chart Gallery when you arrive to add a new Series. There is no practical limit to the number of Series that you can put in one Chart. Adding New Series
Add a Series using the TeeChart Editor (see Tutorial 1) or by code.
Example
[C#]
private void button1_Click(object sender, System.EventArgs e)
        {
            Bar bar1 = new Bar(tChart1.Chart);
            bar1.FillSampleValues(10);
        }

[VB.Net]
Private Sub Button1_Click(ByVal sender As System.Object, ByVal e As System.EventArgs) Handles Button1.Click
        Dim Bar1 As New Steema.TeeChart.Styles.Bar(TChart1.Chart)
        Bar1.FillSampleValues(10)
End Sub
Series are added to the SeriesList and are accessible by Index, TChart1.Series(Index), beginning with 0 for the first Series. TeeChart Pro adds a default name for the Series (Series 0, Series 1, etc.). You may modify the name using the Series.Title property.
Choose Axes for a Series
Series added to the Chart will automatically take the Left and Bottom axes as their reference axes. You may change the reference axes in the Chart Editor by selecting the Series General page for the relevant Series. There are 4 axes available, Top, Left, Bottom and Right. By code, changing the axes will look like this:
[C#]
bar1.VertAxis = Steema.TeeChart.Styles.VerticalAxis.Right;
bar1.HorizAxis = Steema.TeeChart.Styles.HorizontalAxis.Top;
[VB.Net]
Bar1.VertAxis = Steema.TeeChart.Styles.VerticalAxis.Right
Bar1.HorizAxis = Steema.TeeChart.Styles.HorizontalAxis.Top
More than 1 Series may be associated with each Axis. TeeChart will decide the best scale to fit the Series matched to the Axis but you may change Axis scales yourself (See the Axis Tutorial). Additional axes may be added; they will copy the scales associated with their counterpart from the first 4 axes (see the Tutorial section Additional axes).
Connecting Series
You may use a Series as the datasource for another Series. This can be done with the Chart Editor by setting the datasource for the 2nd Series. Go to the Series tab, Datasource page. Select 'Function' as the datasource type. Two Listboxes will appear, available Series and Selected Series. Select the Series you wish to use as the datasource for the present Series, then, in the Combobox above, entitled Functions:, select Average as the function type and click the Apply button. Note that any Series, in this way, may be defined as a function of any other Series and the Function Type may be any of the list available in the Function combobox. To do the same by code see below:
[C#]
Steema.TeeChart.Functions.Average average1 = new Steema.TeeChart.Functions.Average();
line1.Function = average1;
line1.DataSource = bar1;
bar1.FillSampleValues(10);
line1.CheckDataSource();

[VB.Net]
Dim Average1 As New Steema.TeeChart.Functions.Average()
Line1.Function = Average1
Line1.DataSource = Bar1
Bar1.FillSampleValues(10)
Line1.CheckDataSource()
See Tutorial 7 - Working with Functions for more information about how to use TeeChart functions.
Changing Series order
Changing series order is very easy with the Chart Editor. Go to the front page of the Editor and highlight the series that you wish to move. Use the arrow buttons on the right to move the Series up or down in the Series order. Series order will decide the relative display position of the Series in the Chart with respect to other Series. Setting a Series to 'Active=False' will hide the Series from the Chart but maintain its data content intact.
To change series order by code use Series.Exchange.
[C#]
tChart1.Series.Exchange(0, 1);  //Change Series(0) with Series(1) in the index order
[VB.Net]
TChart1.Series.Exchange(0, 1) 'Change Series(0) with Series(1) in the index order
*Note. After exchanging Series, the index for the Series will be changed. Thus the line of code above will perpetually interchange the 2 Series '0' and '1' if the code is rerun, as 0 becomes 1 and 1 becomes 0.
Series Value list
TeeChart Series store their values in a Valuelist accessible and modifiable via the ValueList Class. Accessing Series Values
You may access any value in the list:
Example
[C#]
MessageBox.Show(bar1.YValues[3].ToString()); //Displays value of 4th point (index starts at 0) of a BarSeries
[VB.Net]
MsgBox(Bar1.YValues(3)) 'Displays value of 4th point (index starts at 0) of a BarSeries
Values accessed in this way may be used to set traps on Series data:
[C#]
for(int i = 0; i < bar1.Count; ++i)
            {
                if(bar1.YValues[i] > 500)
                {
                    MessageBox.Show("Value: (" + bar1.XValues[i] + ", " + bar1.YValues[i] + ") exceeds limit");
                }
            }
[VB.Net]
Dim i As Integer
For i = 0 To Bar1.Count
    If Bar1.YValues(i) > 500 Then
        MsgBox("Value: (" & Bar1.XValues(i) & ", " & Bar1.YValues(i) & ") exceeds limit")
    End If
Next
The same value may be obtained via the point ValueIndex used by some Series methods and several Chart events.
Example
[C#]
private void tChart1_ClickSeries(object sender, Steema.TeeChart.Styles.Series s, int valueIndex, System.Windows.Forms.MouseEventArgs e)
        {
            if(s.Equals(bar1))
            {
                MessageBox.Show("ValueIndex is: " + valueIndex.ToString());
                MessageBox.Show("Point's YValue is " + bar1.YValues[valueIndex].ToString());
            }
        }

[VB.Net]
Private Sub TChart1_ClickSeries(ByVal sender As Object, ByVal s As Steema.TeeChart.Styles.Series, ByVal valueIndex As Integer, ByVal e As System.Windows.Forms.MouseEventArgs) Handles TChart1.ClickSeries
        If s Is Bar1 Then
            MsgBox("ValueIndex is: " & valueIndex)
            MsgBox("Point's YValue is " & Bar1.YValues(valueIndex))
        End If
End Sub
Example using Values
This code modifies the value of a BarSeries Bar according to the user's mouseclick.
Example
Use the TChart.ClickSeries event to determine where the user has clicked.
[C#]
private void tChart1_ClickSeries(object sender, Steema.TeeChart.Styles.Series s, int valueIndex, System.Windows.Forms.MouseEventArgs e)
        {
            UpDatePoint(valueIndex,tChart1.Axes.Left.CalcPosPoint((e.Y)));
        }

[VB.Net]
Private Sub TChart1_ClickSeries(ByVal sender As Object, ByVal s As Steema.TeeChart.Styles.Series, ByVal valueIndex As Integer, ByVal e As System.Windows.Forms.MouseEventArgs) Handles TChart1.ClickSeries
        UpDatePoint(valueIndex, TChart1.Axes.Left.CalcPosPoint(e.Y))
End Sub
Call the UpdatePoint Sub routine to modify the Bar's value:
[C#]
private void UpDatePoint(int Bar, double Y)
        {
            if(Bar < tChart1.Series[0].Count)
            {
                tChart1.Series[0].YValues[Bar] = Y;
                tChart1.Series[0].Repaint();
            }
        }

[VB.Net]
Private Sub UpDatePoint(ByVal Bar As Integer, ByVal Y As Double)
        If Bar < TChart1.Series(0).Count Then
            TChart1.Series(0).YValues(Bar) = Y
            TChart1.Series(0).Repaint()
        End If
End Sub
Series events
The previous section introduces some use of Series events. This section shows some additional uses. OnClickSeries
You may use the OnClickSeries event to obtain almost any information about a Series (see the section, Accessing Series Values).
These examples apply to a Series with Datetime data eg These test values may be used for the following event examples:
[C#]
private void button1_Click(object sender, System.EventArgs e)
        {
            Random rnd = new Random();
            line1.XValues.DateTime = true;
            line1.Pointer.Visible = true;
            line1.Add(DateTime.Parse("25/12/2002 10:30:00"),rnd.Next(100),"", Color.Red);
            line1.Add(DateTime.Parse("25/12/2002 22:30:00"),rnd.Next(100),"", Color.Red);
            line1.Add(DateTime.Parse("26/12/2002 09:20:00"),rnd.Next(100),"", Color.Red);
            line1.Add(DateTime.Parse("26/12/2002 23:30:00"),rnd.Next(100),"", Color.Red);
            line1.Add(DateTime.Parse("27/12/2002 11:10:00"),rnd.Next(100),"", Color.Red);
            line1.Add(DateTime.Parse("27/12/2002 20:15:00"),rnd.Next(100),"", Color.Red);
            line1.Add(DateTime.Parse("28/12/2002 08:15:00"),rnd.Next(100),"", Color.Red);
            line1.Add(DateTime.Parse("28/12/2002 21:45:00"),rnd.Next(100),"", Color.Red);
            line1.Add(DateTime.Parse("29/12/2002 12:45:00"),rnd.Next(100),"", Color.Red);
            line1.Add(DateTime.Parse("29/12/2002 22:05:00"),rnd.Next(100),"", Color.Red);

            line1.HorizAxis = Steema.TeeChart.Styles.HorizontalAxis.Top;
        }

private void tChart1_ClickSeries(object sender, Steema.TeeChart.Styles.Series s, int valueIndex, System.Windows.Forms.MouseEventArgs e)
        {
            //The below will show the Value of the nearest Point, not the exact Axis value at the clicked X and Y.
            MessageBox.Show("Date is: " + DateTime.FromOADate(line1.XValues[valueIndex])
            + " Value is: " + line1.YValues[valueIndex]);
        }

[VB.Net]
Private Sub Button1_Click(ByVal sender As System.Object, ByVal e As System.EventArgs) Handles Button1.Click
        Dim rnd As New Random()
        Line1.XValues.DateTime = True
        Line1.Pointer.Visible = True
        Line1.Add(DateTime.Parse("25/12/2002 10:30:00"), rnd.Next(100), "", Color.Red)
        Line1.Add(DateTime.Parse("25/12/2002 22:30:00"), rnd.Next(100), "", Color.Red)
        Line1.Add(DateTime.Parse("26/12/2002 09:20:00"), rnd.Next(100), "", Color.Red)
        Line1.Add(DateTime.Parse("26/12/2002 23:30:00"), rnd.Next(100), "", Color.Red)
        Line1.Add(DateTime.Parse("27/12/2002 11:10:00"), rnd.Next(100), "", Color.Red)
        Line1.Add(DateTime.Parse("27/12/2002 20:15:00"), rnd.Next(100), "", Color.Red)
        Line1.Add(DateTime.Parse("28/12/2002 08:15:00"), rnd.Next(100), "", Color.Red)
        Line1.Add(DateTime.Parse("28/12/2002 21:45:00"), rnd.Next(100), "", Color.Red)
        Line1.Add(DateTime.Parse("29/12/2002 12:45:00"), rnd.Next(100), "", Color.Red)
        Line1.Add(DateTime.Parse("29/12/2002 22:05:00"), rnd.Next(100), "", Color.Red)

        Line1.HorizAxis = Steema.TeeChart.Styles.HorizontalAxis.Top
End Sub

Private Sub TChart1_ClickSeries(ByVal sender As Object, ByVal s As Steema.TeeChart.Styles.Series, ByVal valueIndex As Integer, ByVal e As System.Windows.Forms.MouseEventArgs) Handles TChart1.ClickSeries
        'The below will show the Value of the nearest Point, not the exact Axis value at the clicked X and Y.
        MsgBox("Date is: " & DateTime.FromOADate(Line1.XValues(valueIndex)) _
              & " Value is: " & Line1.YValues(valueIndex))
End Sub
OnGetSeriesPointerStyle
For those Series that use the TChart Pointer, you may access and modify the Pointer using the OnGetSeriesPointer event:
Drawing an Uptriangle if the Point is higher than the last, DownTriangle if lower, etc.
[C#]
private void line1_GetPointerStyle(Steema.TeeChart.Styles.CustomPoint series, Steema.TeeChart.Styles.GetPointerStyleEventArgs e)
        {
            if(e.ValueIndex > 0)
            {
                if(line1.YValues[e.ValueIndex] > line1.YValues[e.ValueIndex - 1])
                {
                    e.Style = Steema.TeeChart.Styles.PointerStyles.Triangle;
                }
                else if(line1.YValues[e.ValueIndex] < line1.YValues[e.ValueIndex - 1])
                {
                    e.Style = Steema.TeeChart.Styles.PointerStyles.DownTriangle;
                }
                else
                {
                    e.Style = Steema.TeeChart.Styles.PointerStyles.Diamond;
                }
            }
            else
            {
                e.Style = Steema.TeeChart.Styles.PointerStyles.Diamond;
            }
        }

[VB.Net]
Private Sub Line1_GetPointerStyle(ByVal series As Steema.TeeChart.Styles.CustomPoint, ByVal e As Steema.TeeChart.Styles.GetPointerStyleEventArgs) Handles Line1.GetPointerStyle
        If e.ValueIndex > 0 Then
            If (Line1.YValues(e.ValueIndex) > Line1.YValues(e.ValueIndex - 1)) Then
                e.Style = Steema.TeeChart.PointerStyles.Triangle
            ElseIf (Line1.YValues(e.ValueIndex) < Line1.YValues(e.ValueIndex - 1)) Then
                e.Style = Steema.TeeChart.Styles.PointerStyles.DownTriangle
            Else
                e.Style = Steema.TeeChart.Styles.PointerStyles.Diamond
            End If
        Else
            e.Style = Steema.TeeChart.Styles.PointerStyles.Diamond
        End If
End Sub
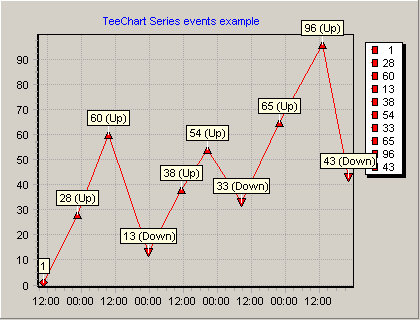
OnGetSeriesMark
Use the OnGetSeriesMark event to modify the Mark contents at runtime. The following code varies the MarkText according to the value relative to the last;
TeeChart supports the dragging of Marks in cases of overlapping via the DragMarks Tool:
[C#]
private void line1_GetSeriesMark(Steema.TeeChart.Styles.Series series, Steema.TeeChart.Styles.GetSeriesMarkEventArgs e)
        {
            if(e.ValueIndex > 0)
            {
                if(line1.YValues[e.ValueIndex] > line1.YValues[e.ValueIndex - 1])
                {
                    e.MarkText = e.MarkText + " (Up)";
                }
                else if(line1.YValues[e.ValueIndex] < line1.YValues[e.ValueIndex - 1])
                {
                    e.MarkText = e.MarkText + " (Down)";
                }
                else
                {
                    e.MarkText = e.MarkText + " (No Change)";
                }
            }
        }

[VB.Net]
Private Sub Line1_GetSeriesMark(ByVal series As Steema.TeeChart.Styles.Series, ByVal e As Steema.TeeChart.Styles.GetSeriesMarkEventArgs) Handles Line1.GetSeriesMark
        If (e.ValueIndex > 0) Then
            If (Line1.YValues(e.ValueIndex) > Line1.YValues(e.ValueIndex - 1)) Then
                e.MarkText = e.MarkText + " (Up)"
            ElseIf (Line1.YValues(e.ValueIndex) < Line1.YValues(e.ValueIndex - 1)) Then
                e.MarkText = e.MarkText + " (Down)"
            End If
        Else
            e.MarkText = e.MarkText + " (No Change)"
        End If
End Sub
The Chart appearance resulting from the last 2 events is: